Version 3.2.0 - 6/30/2022
# Version 3.2.0 - 6/30/2022
We have a really exciting release that really refines the UX of the system, to move between services and resources with ease. Moving around your AWS account, whether in the cloud or against LocalStack, has never been easier.
# Account Dashboard
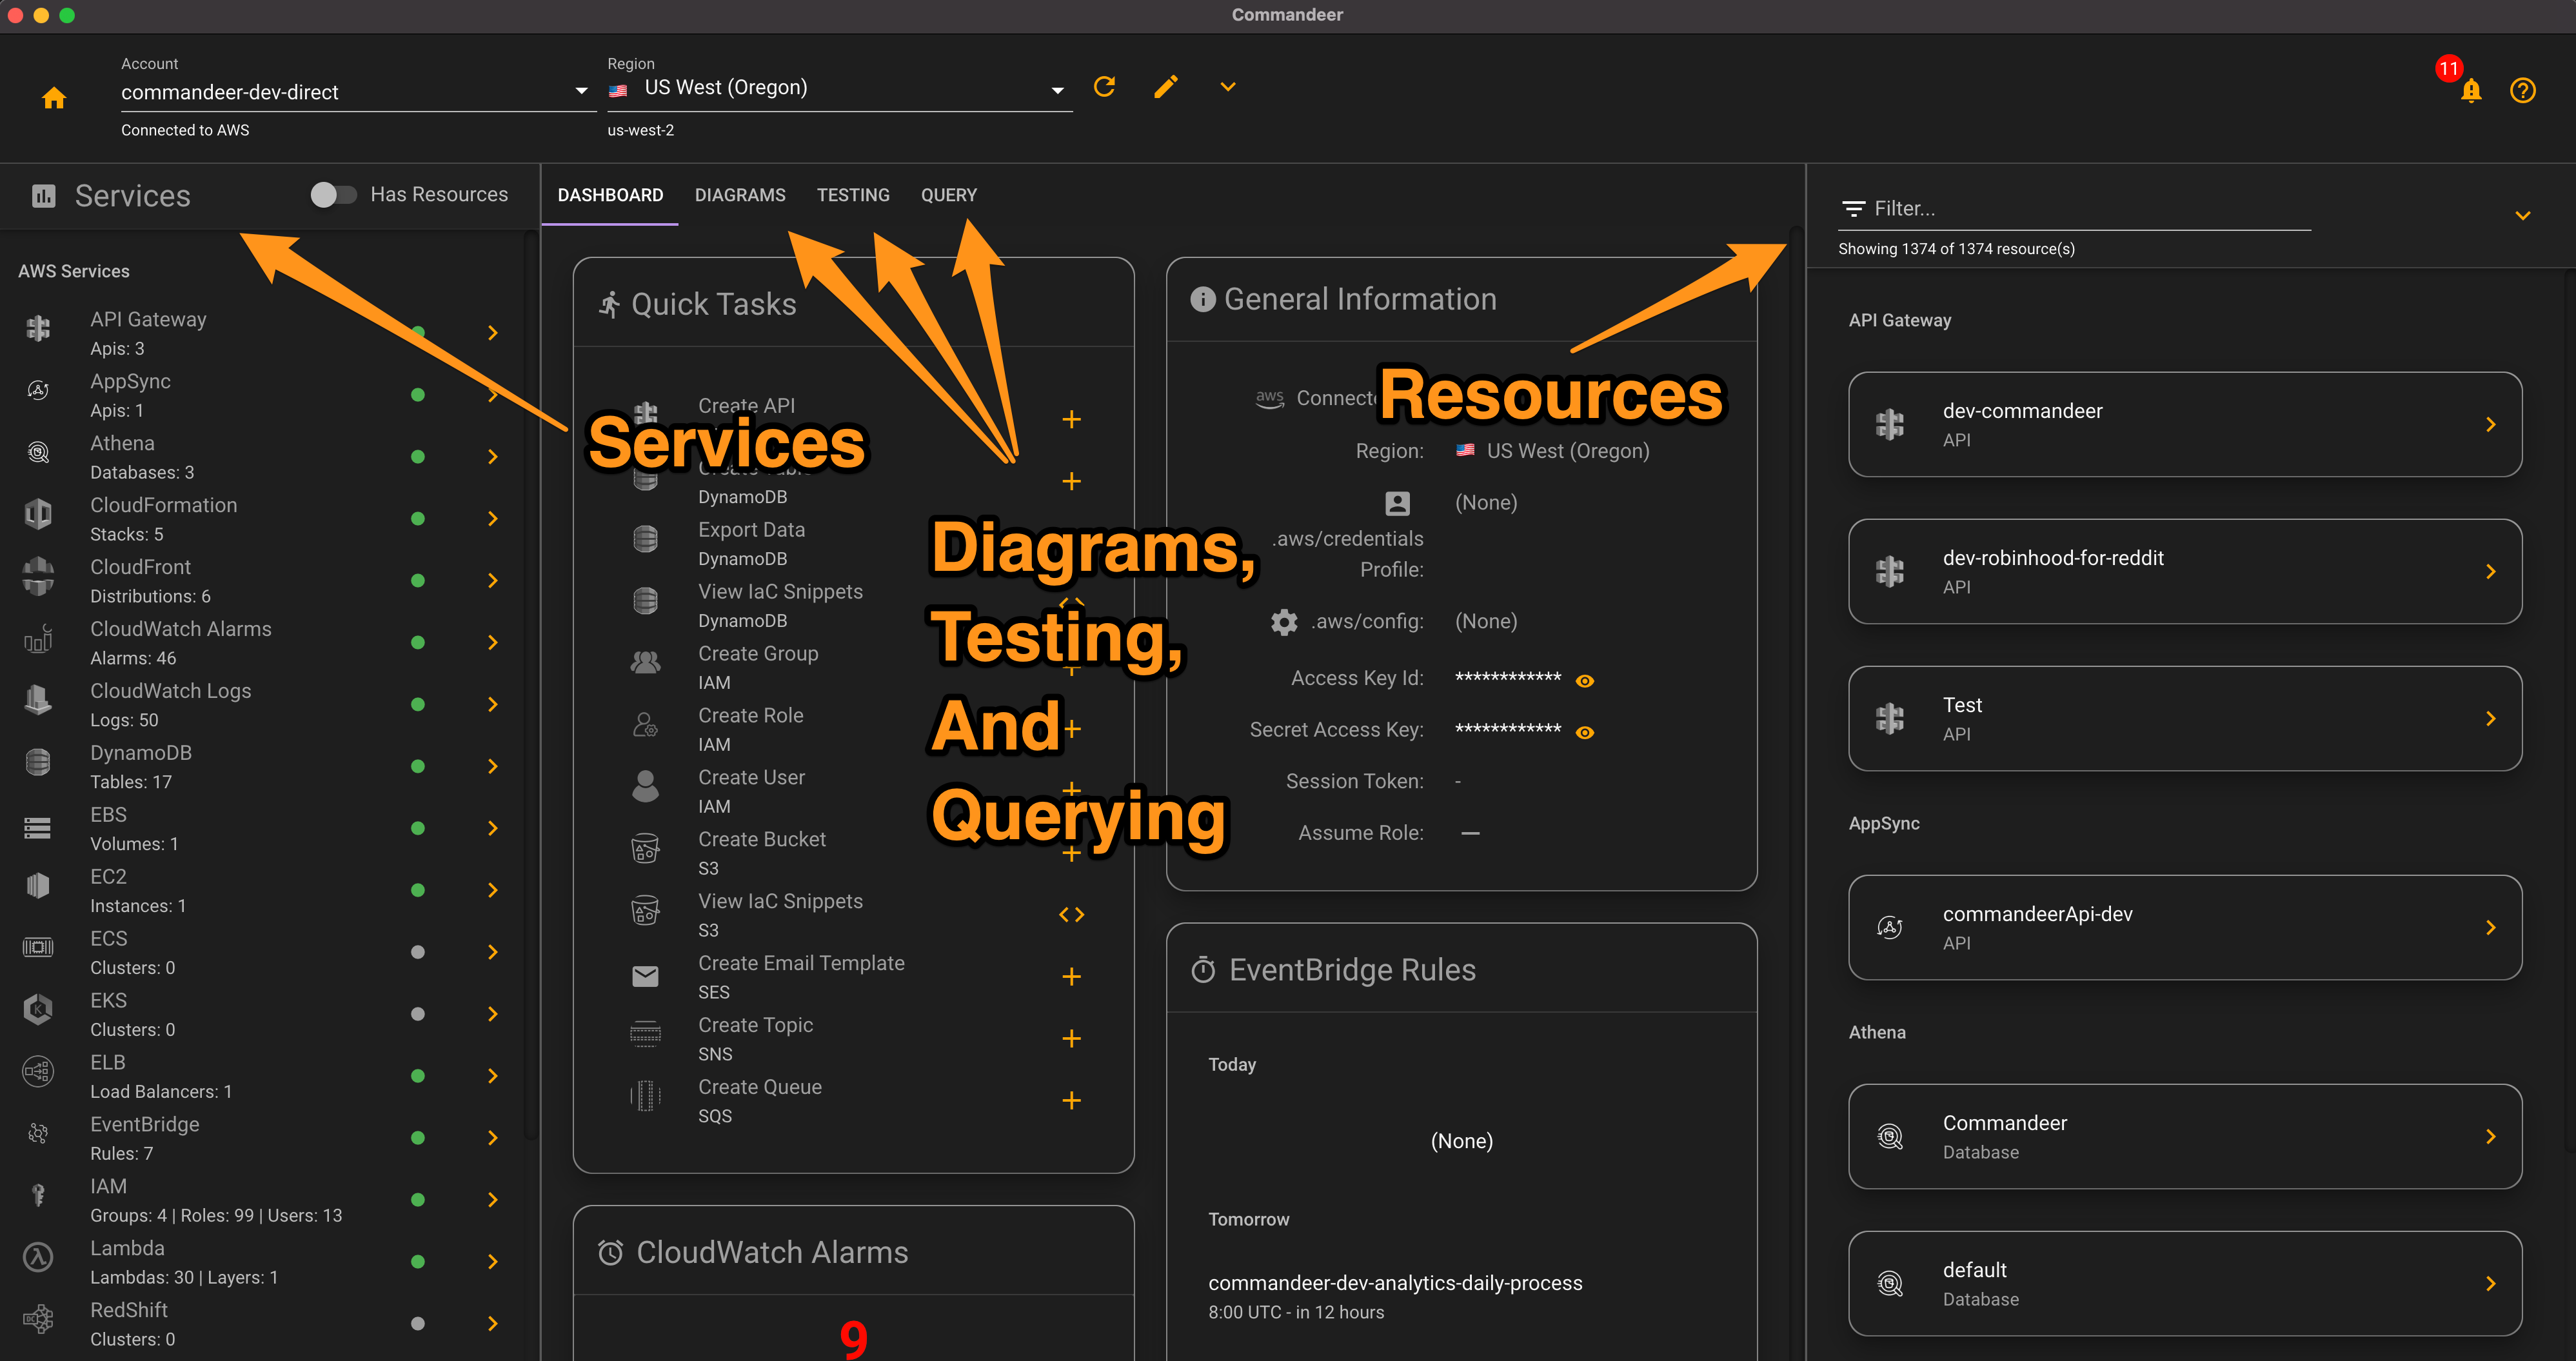
The account dashboard is the main focus of the changes to the ux. It is now broken down into 3 sections as you can see below.
# Services
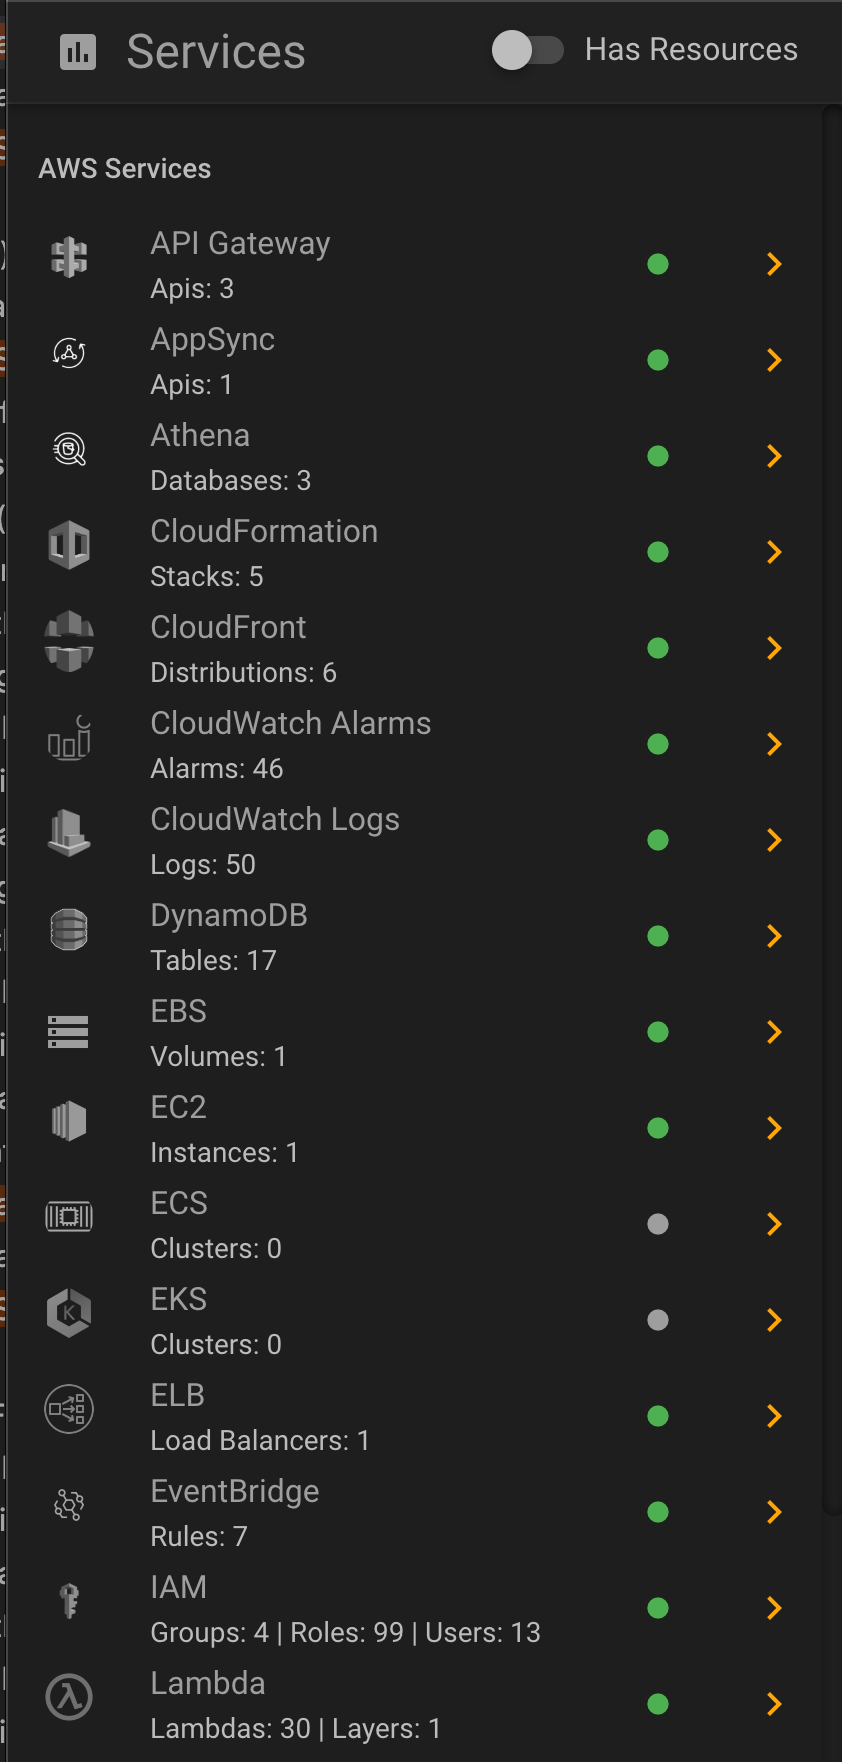
On the left hand side is all or your services. For example, DynamoDB, S3, Lambda, SQS, etc. This allows you to quickly jump into the main dashboard of each service.
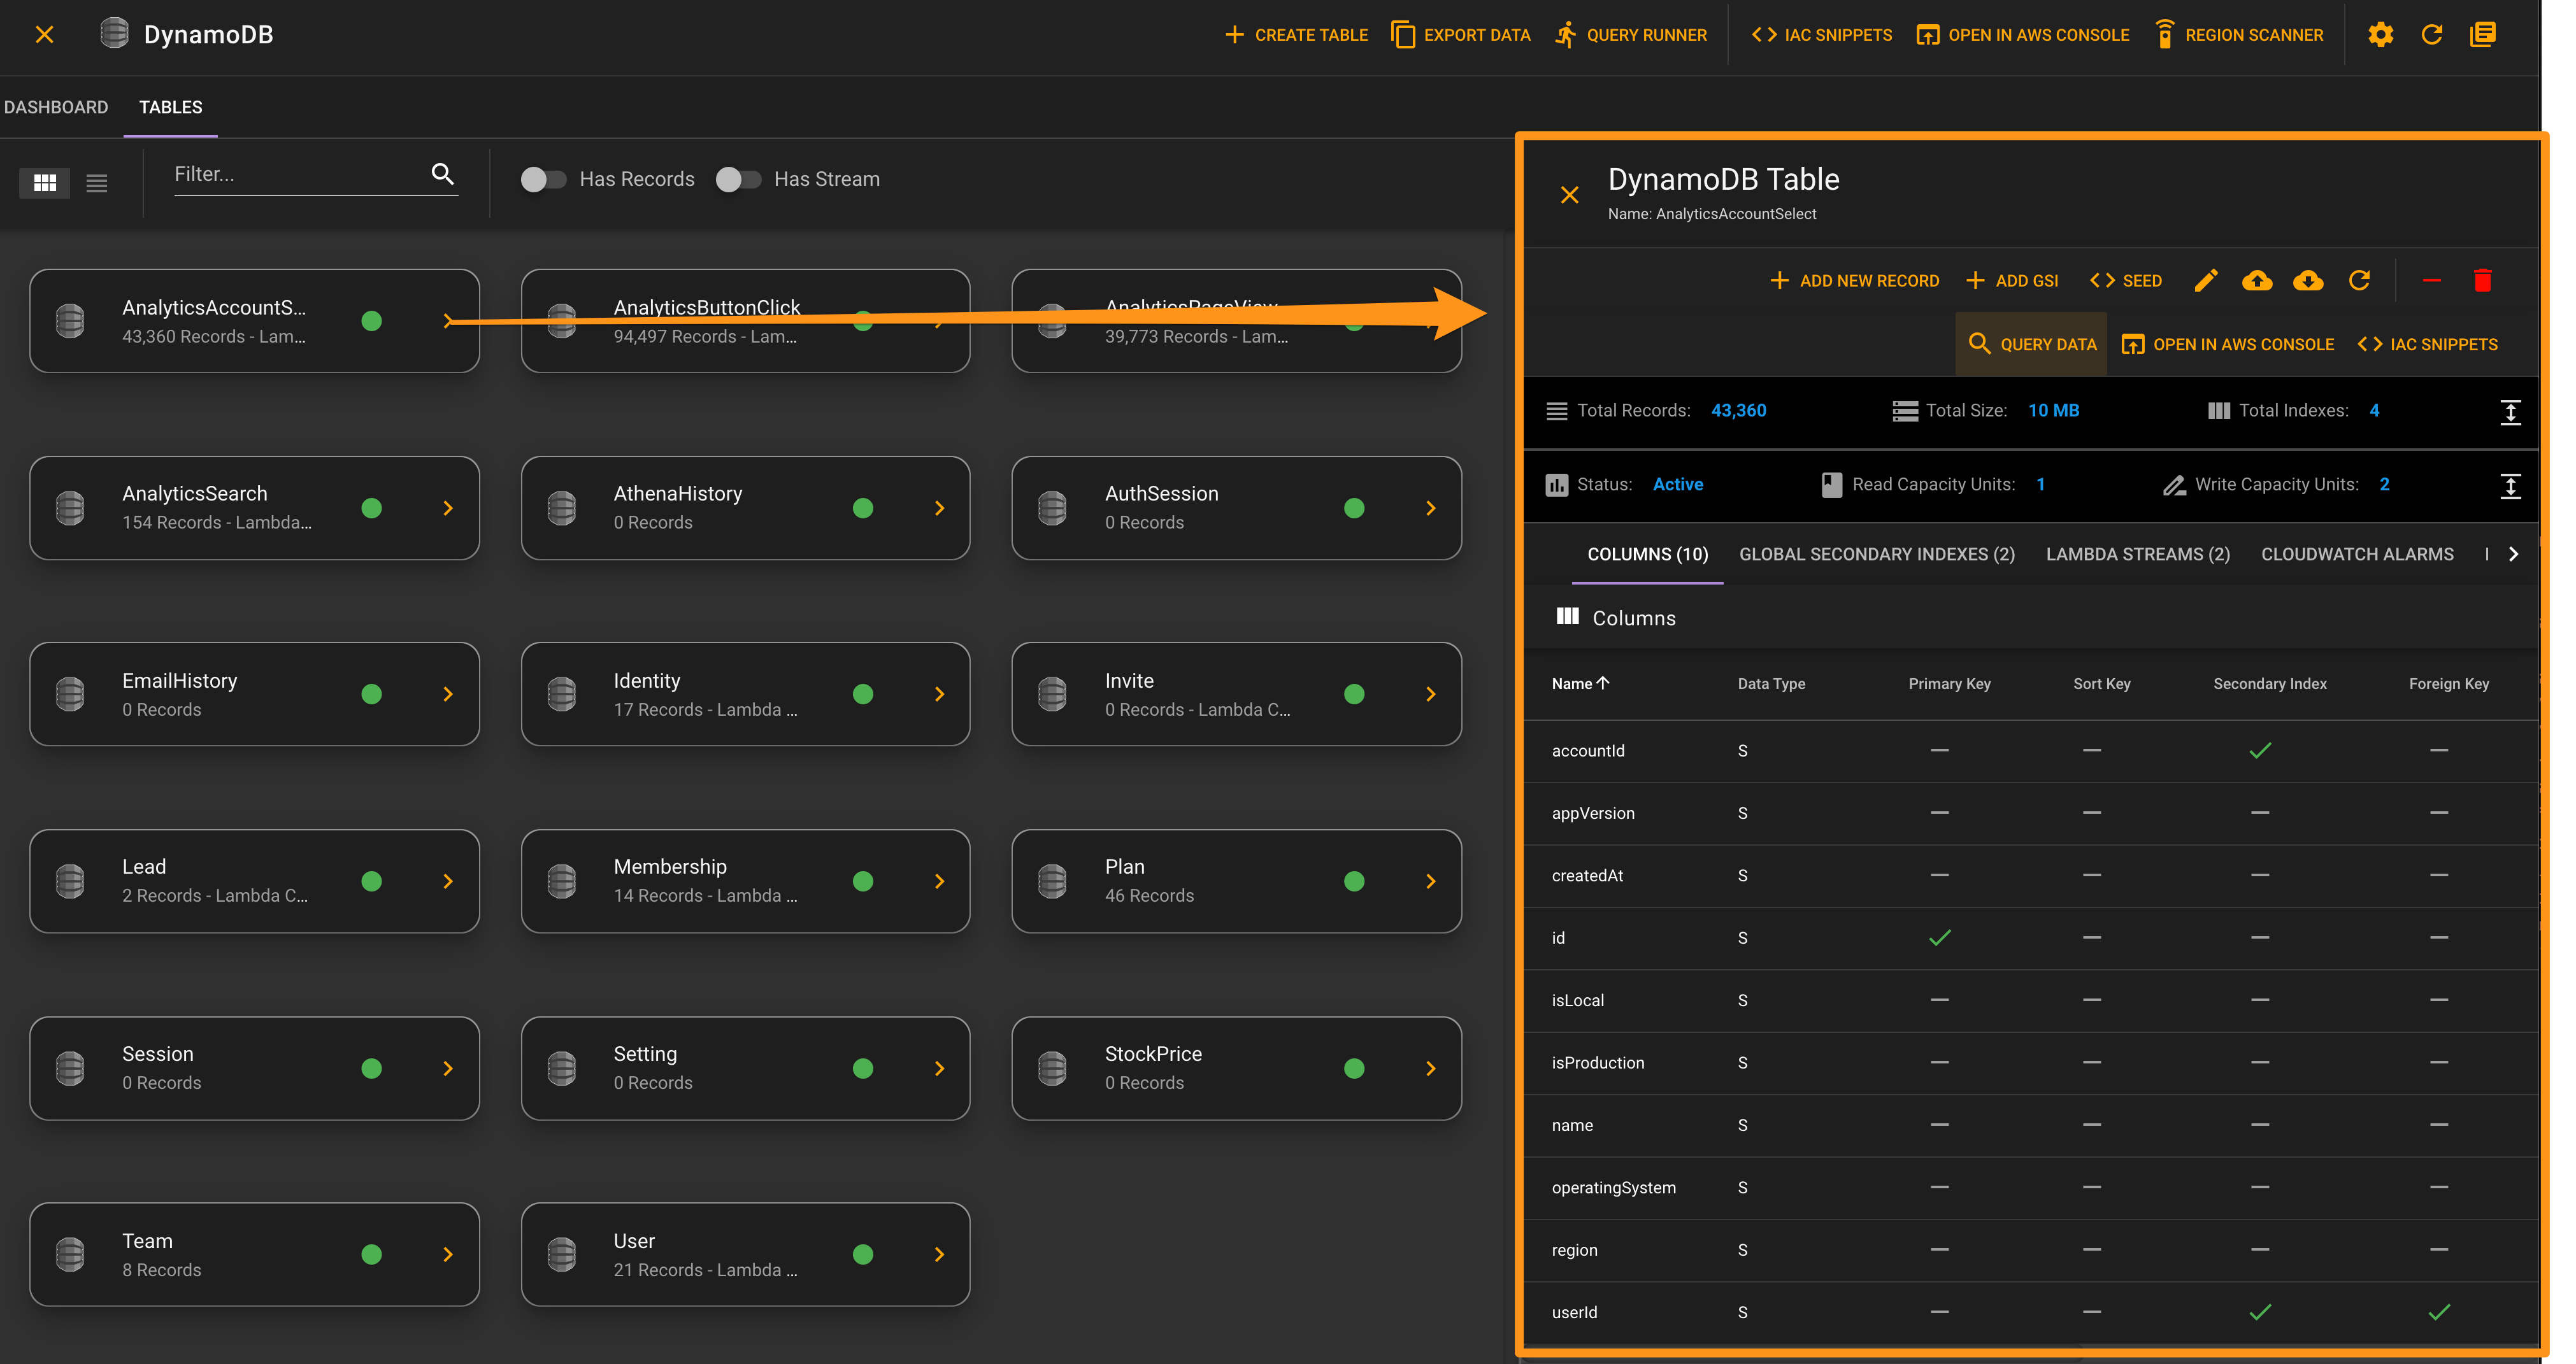
Clicking into any service has changed a bit too. You will still be taken into the main dashboard for the service. But, now when you click on any row or card in the dashboard, the resource will appear on the right-hand side. Again, keeping you in context, so that you can quickly peruse many different things without constantly changing pages or tabs.
Below you can see the DynamoDB service dashboard.
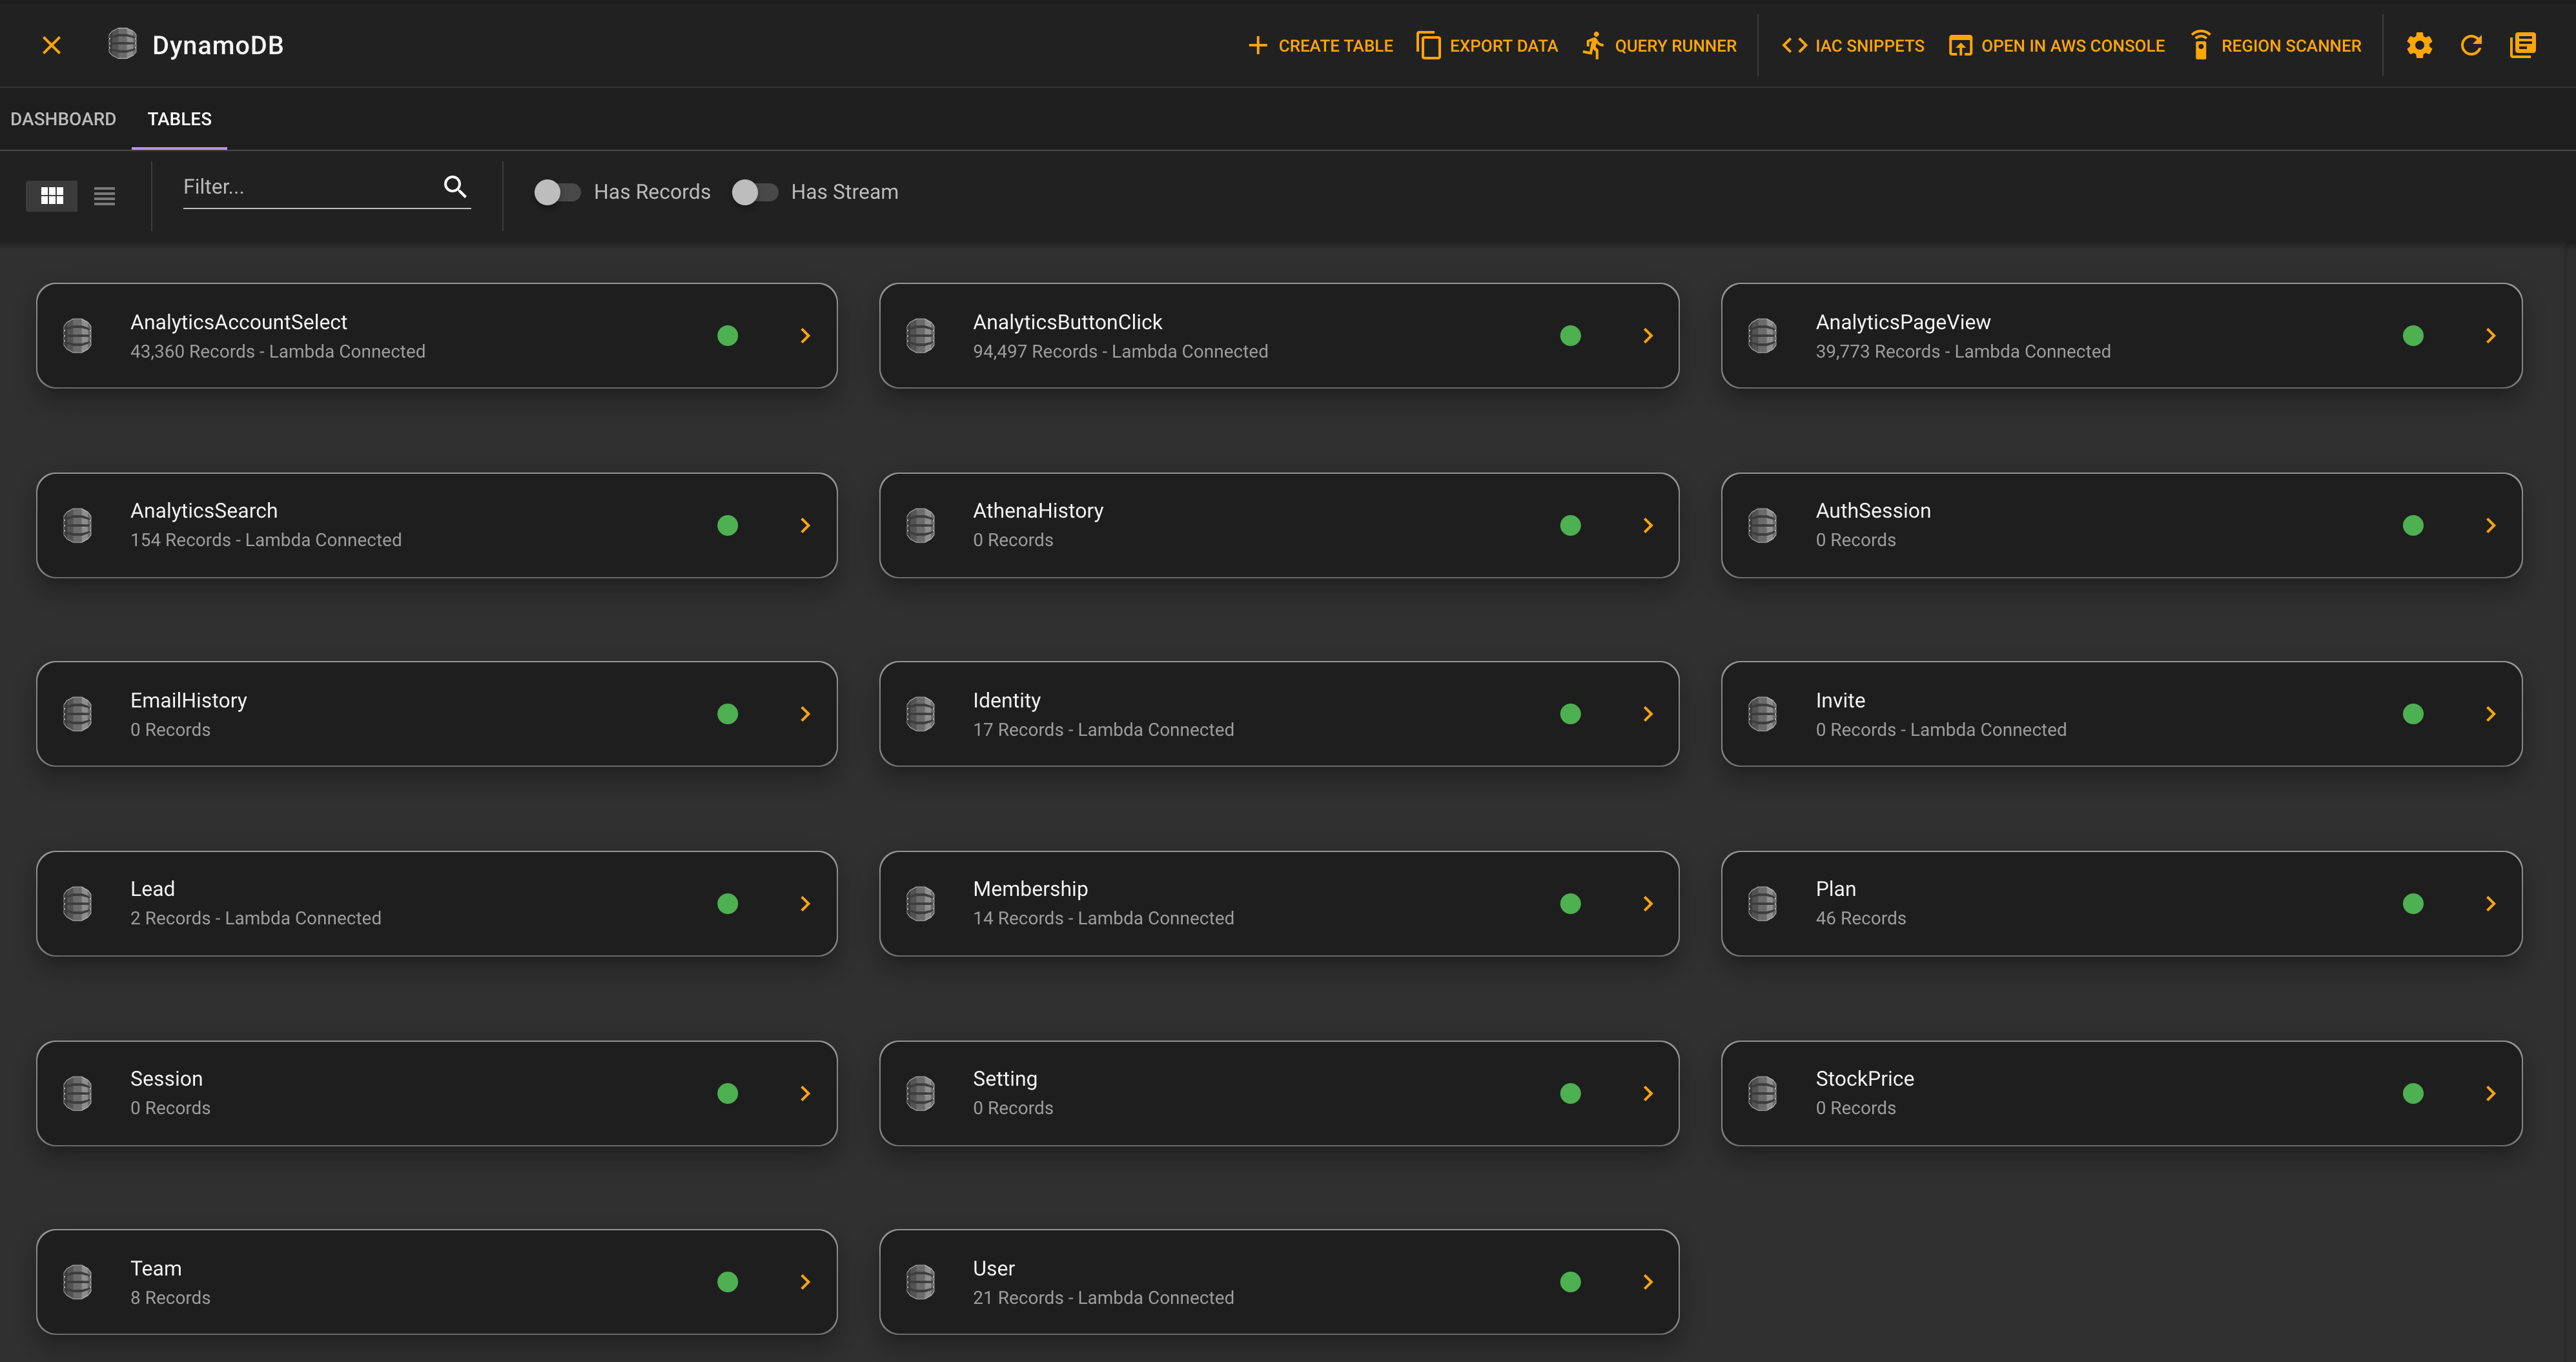
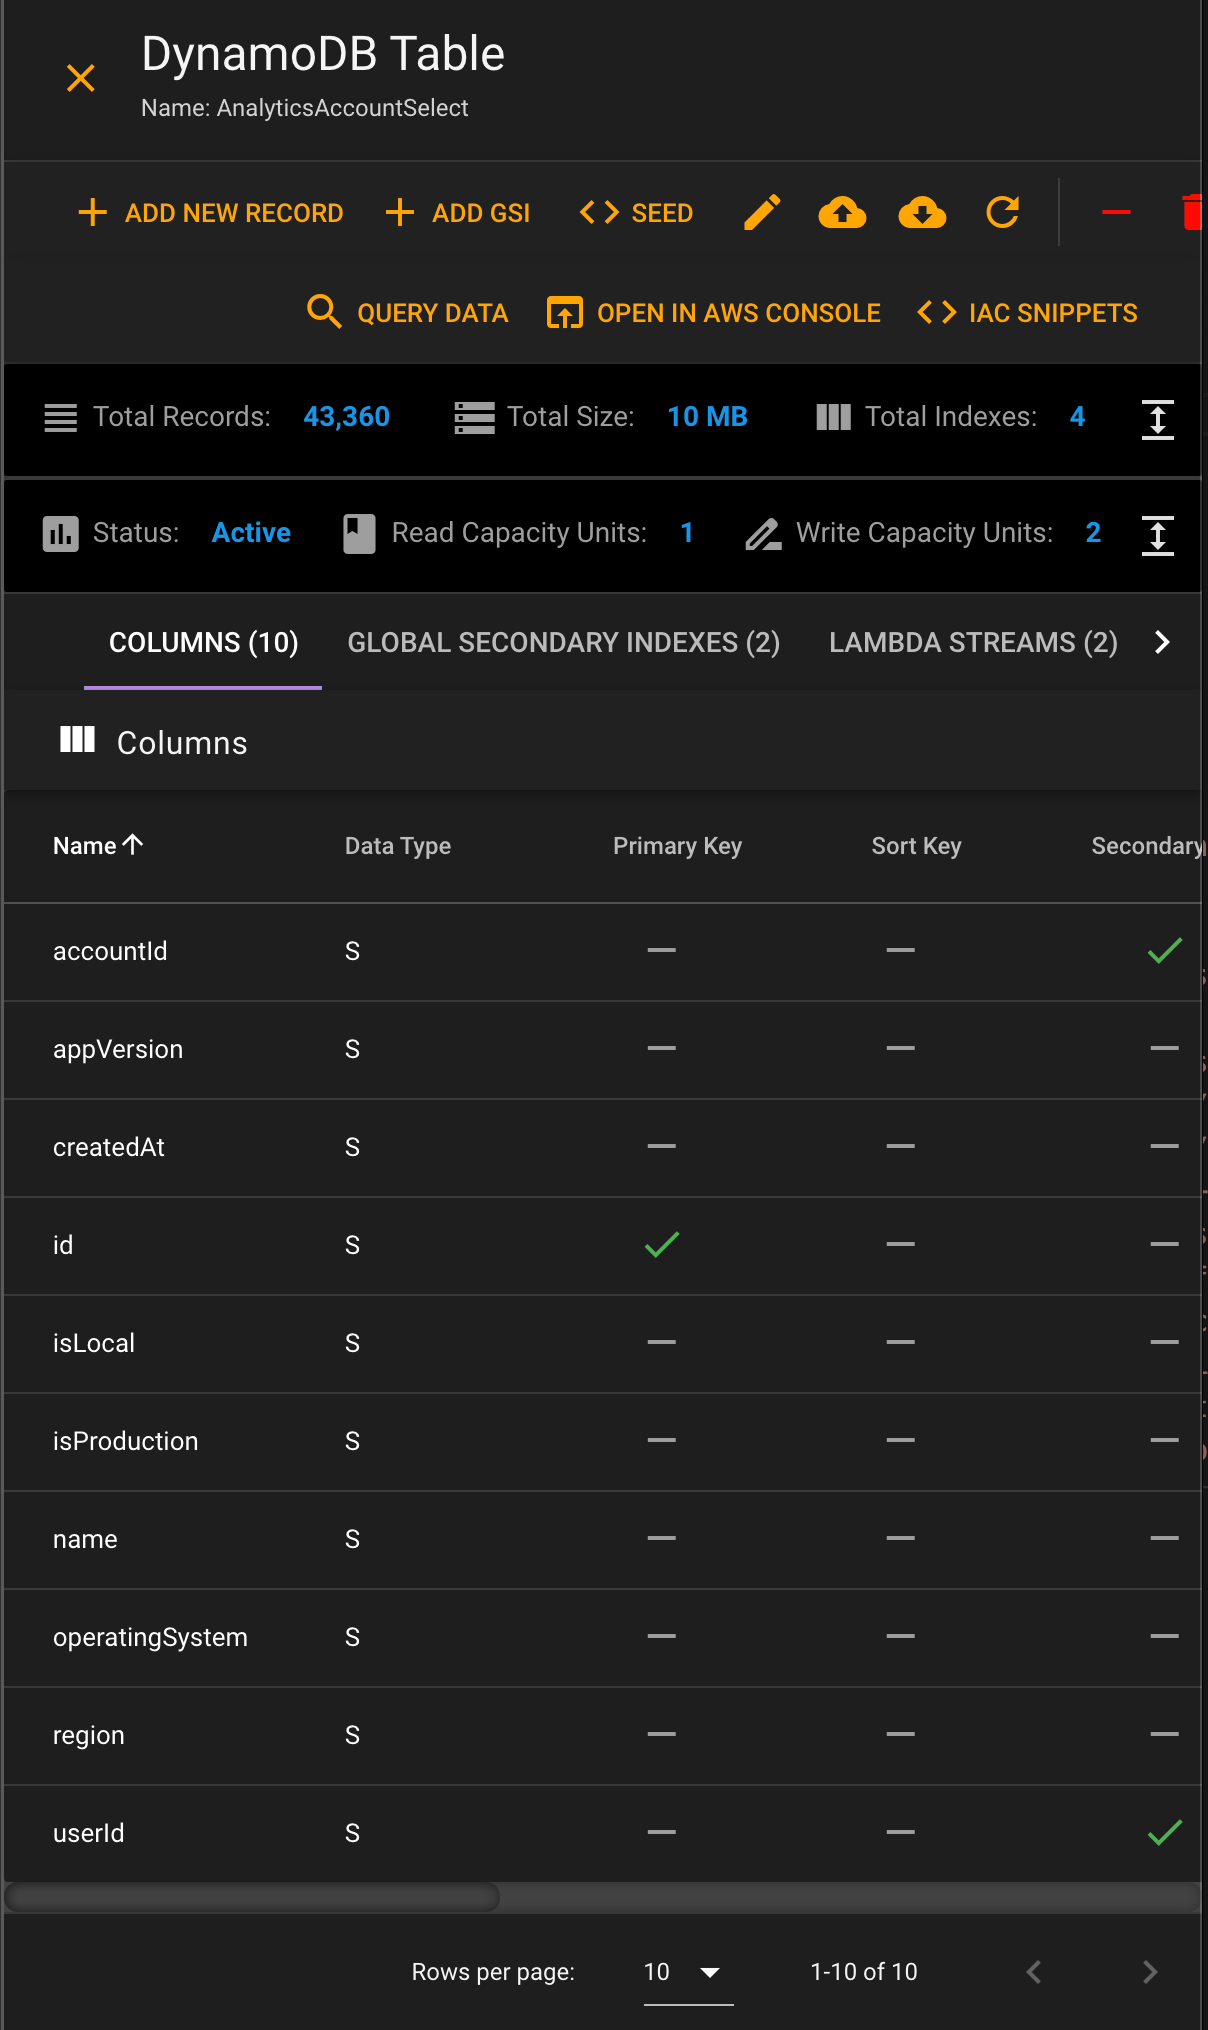
And then clicking on a card, will show you that tables detail information.
# Main Section
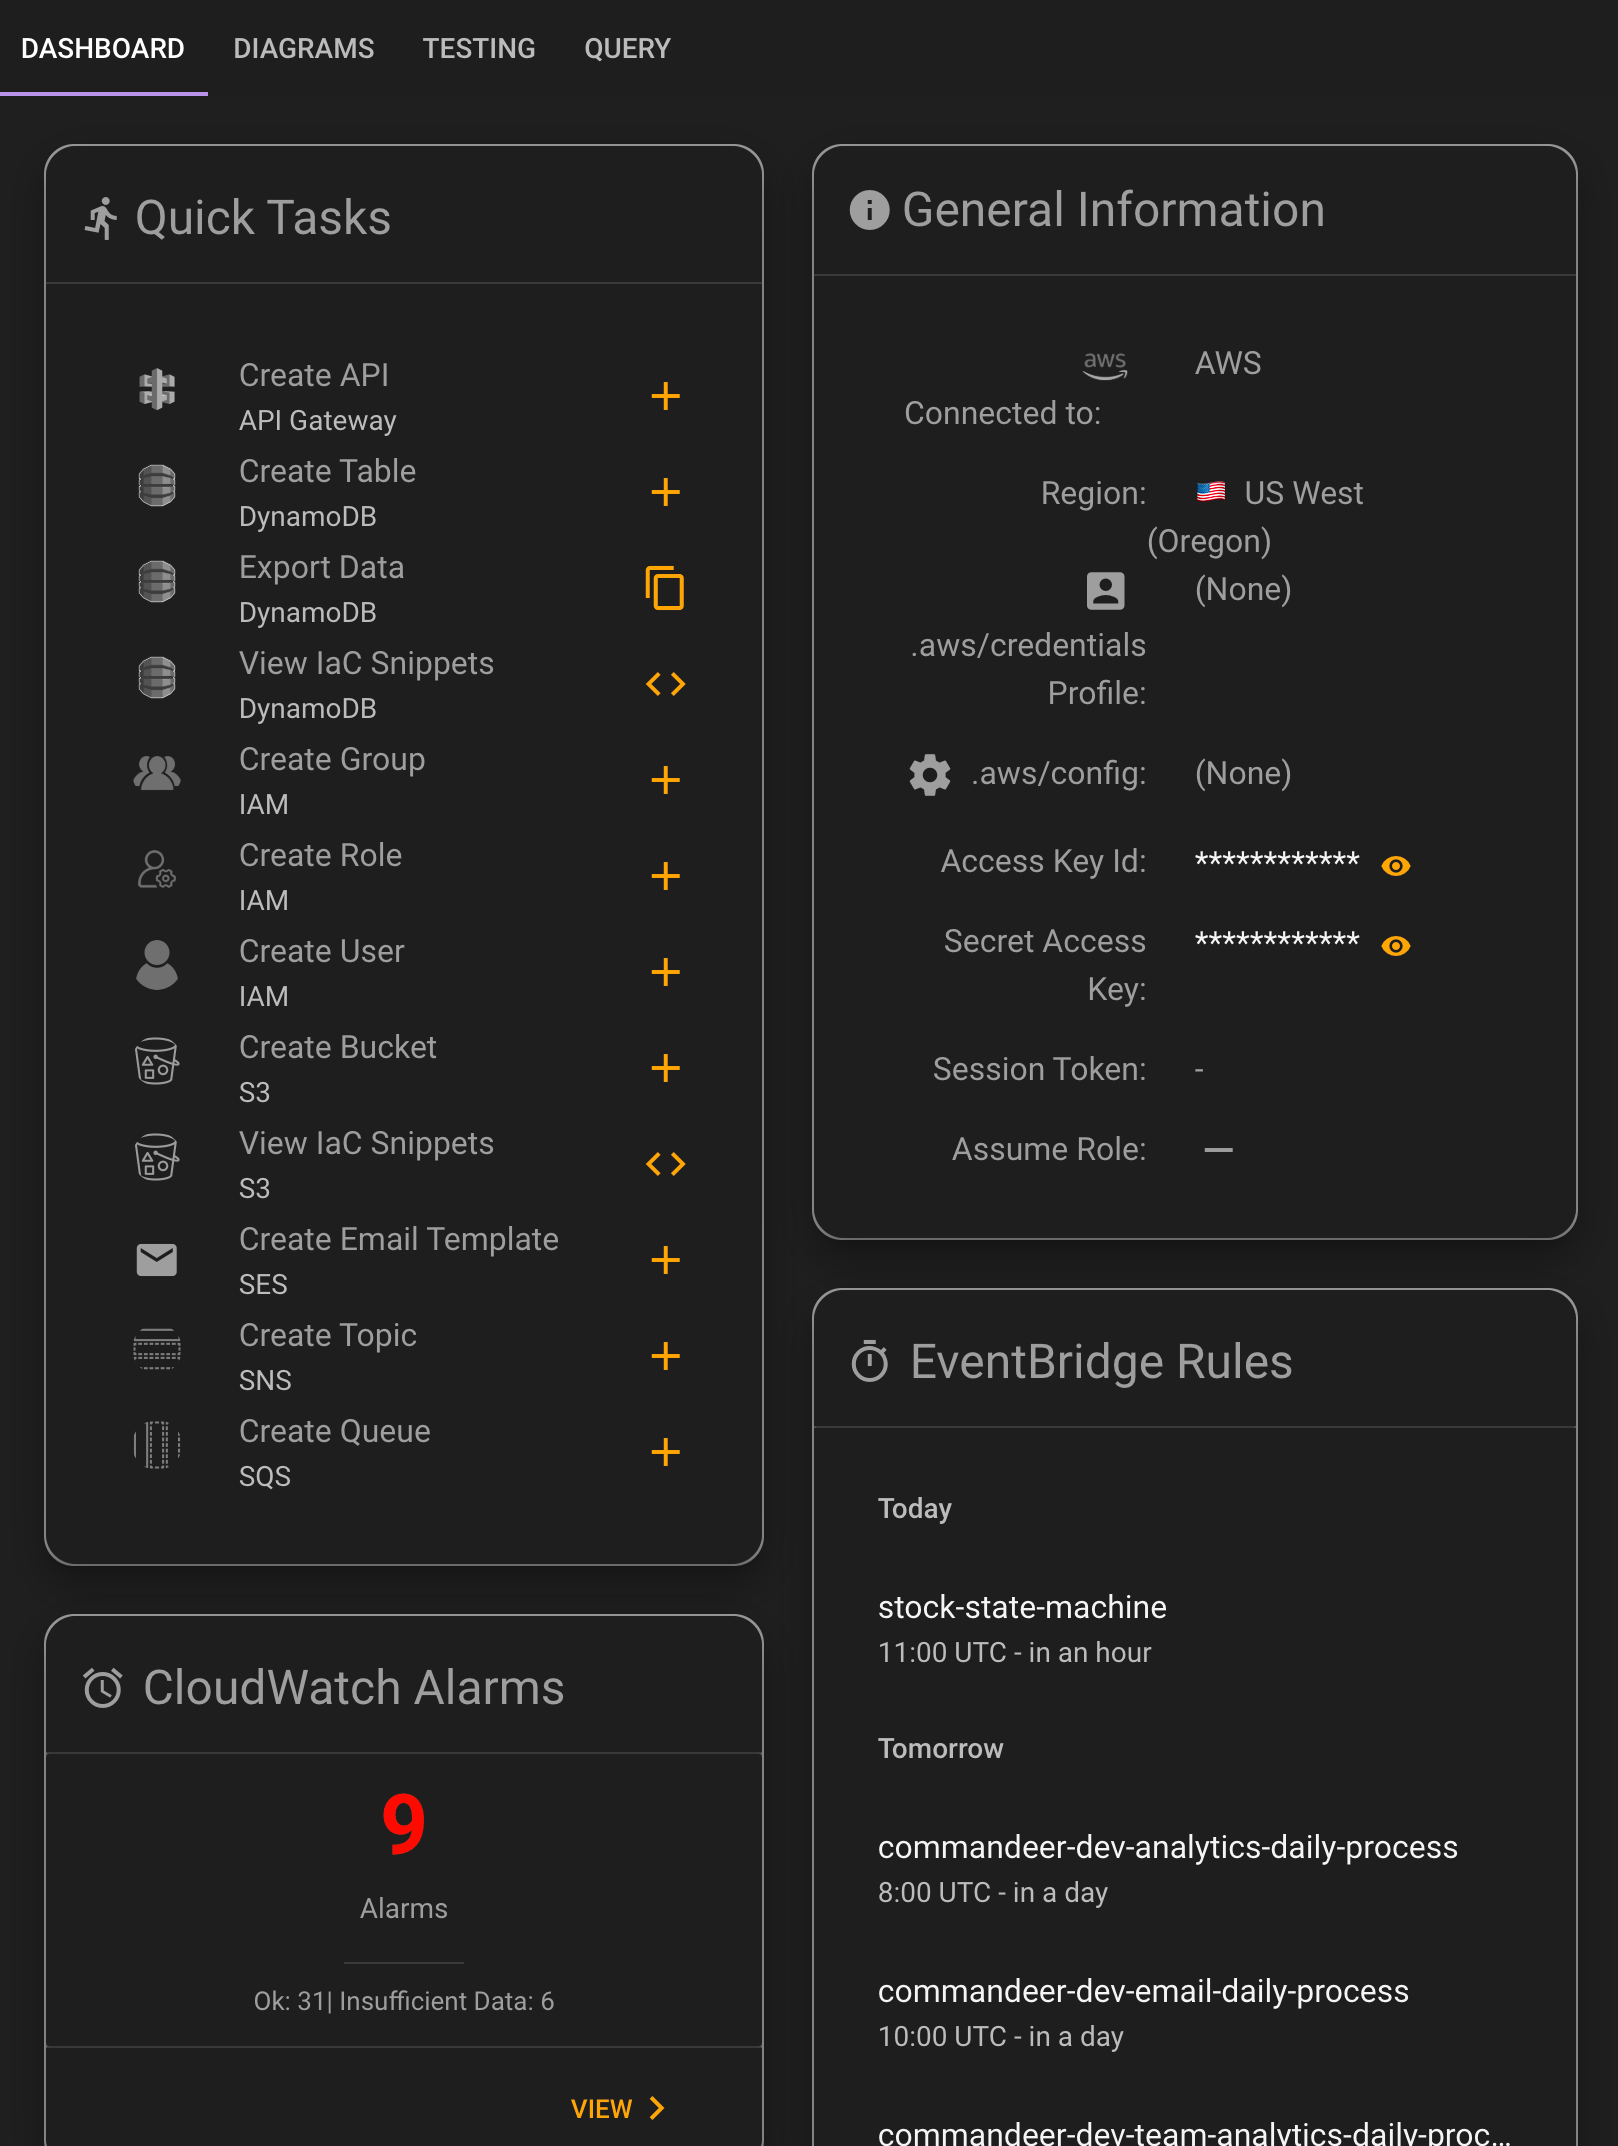
The main section is in the middle of the page. This has an overall dashboard showing configuration of the account. Quick tasks like adding a new S3 bucket or DynamoDB table. Lastly, it shows and CloudWatch Alarms that are set on the account, and any upcoming EventBridge Rules (CRON).
There are also tabs in here to take you to system and ER diagrams. Testing of lambda's for API Gateway, DynamoDB Streams, S3, SNS, SQS, Step Functions, and direct invocation of Lambda's. The query tab allows you to run queries against your data in Athena, Redshift, Postgres, AppSync, and DynamoDB.
# Universal Search
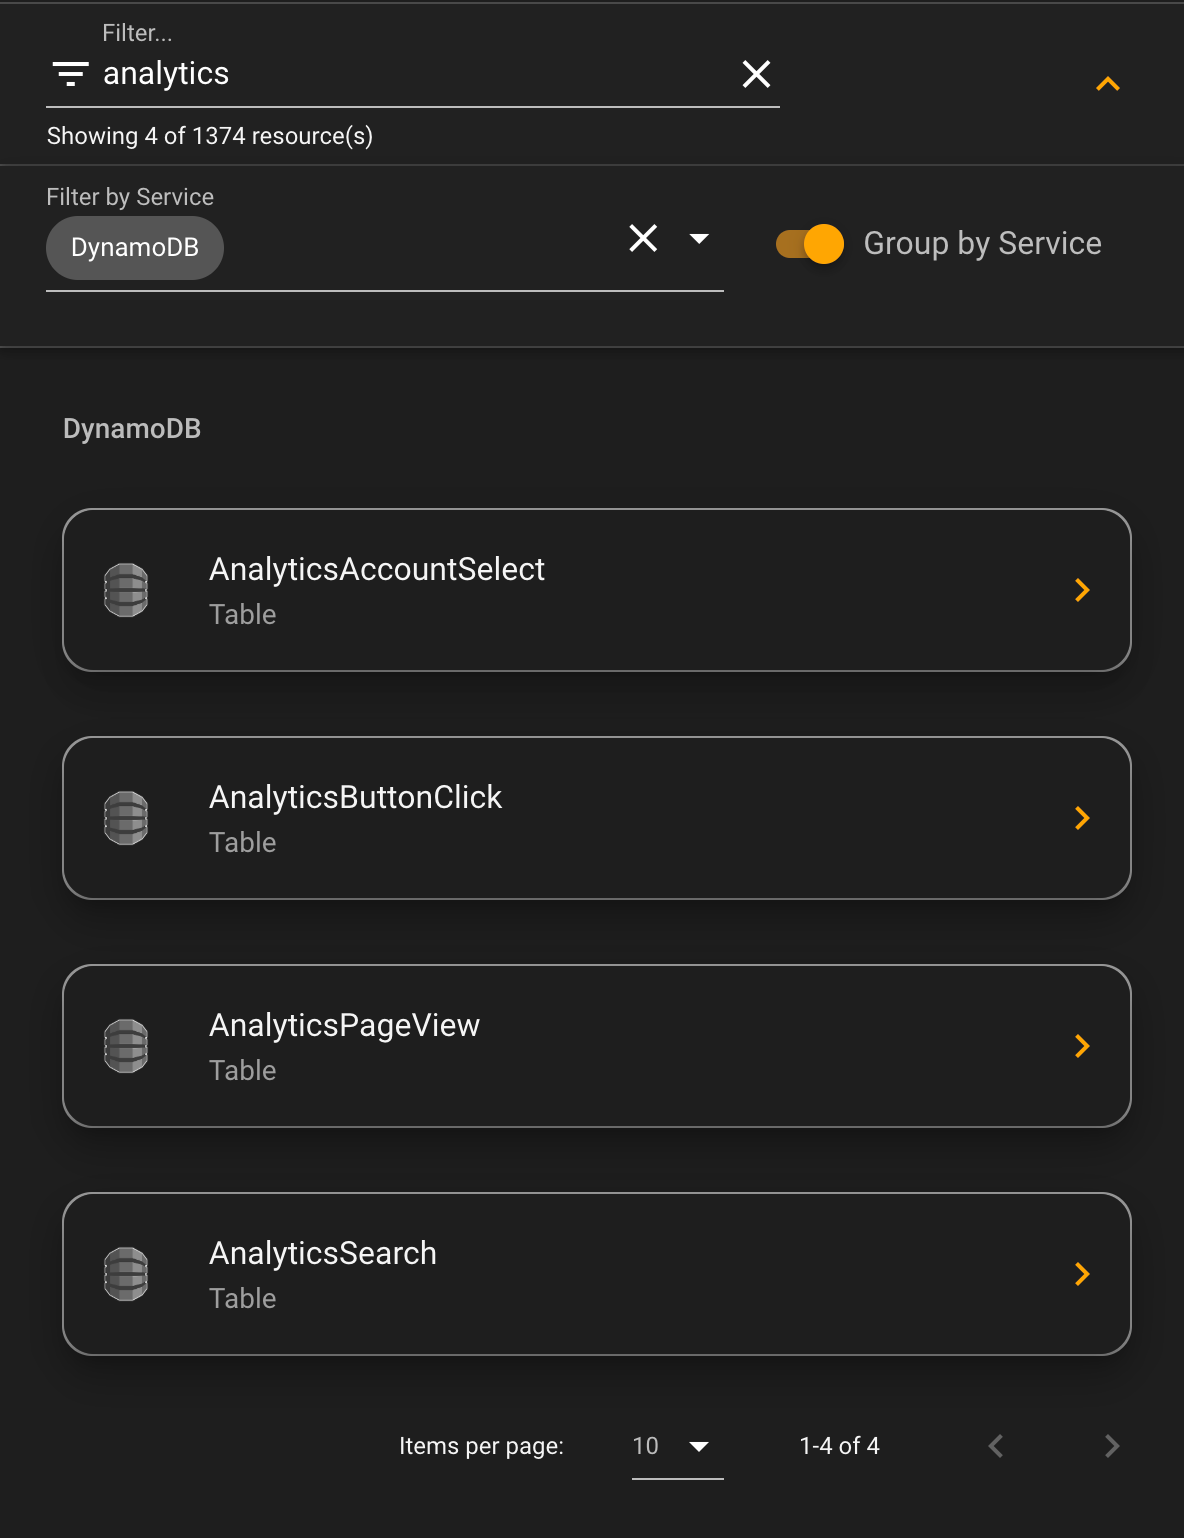
The last section is the universal search of all your resources in the account. This is a very exciting feature, as now you can quickly and effortlessly get to resources that you need to see. For instance, in the video below, you can see that we are searching for a DynamoDB table with analytics in the name. The beauty of this, is that you stay in context, with the selected resource popping up directly in the search area.
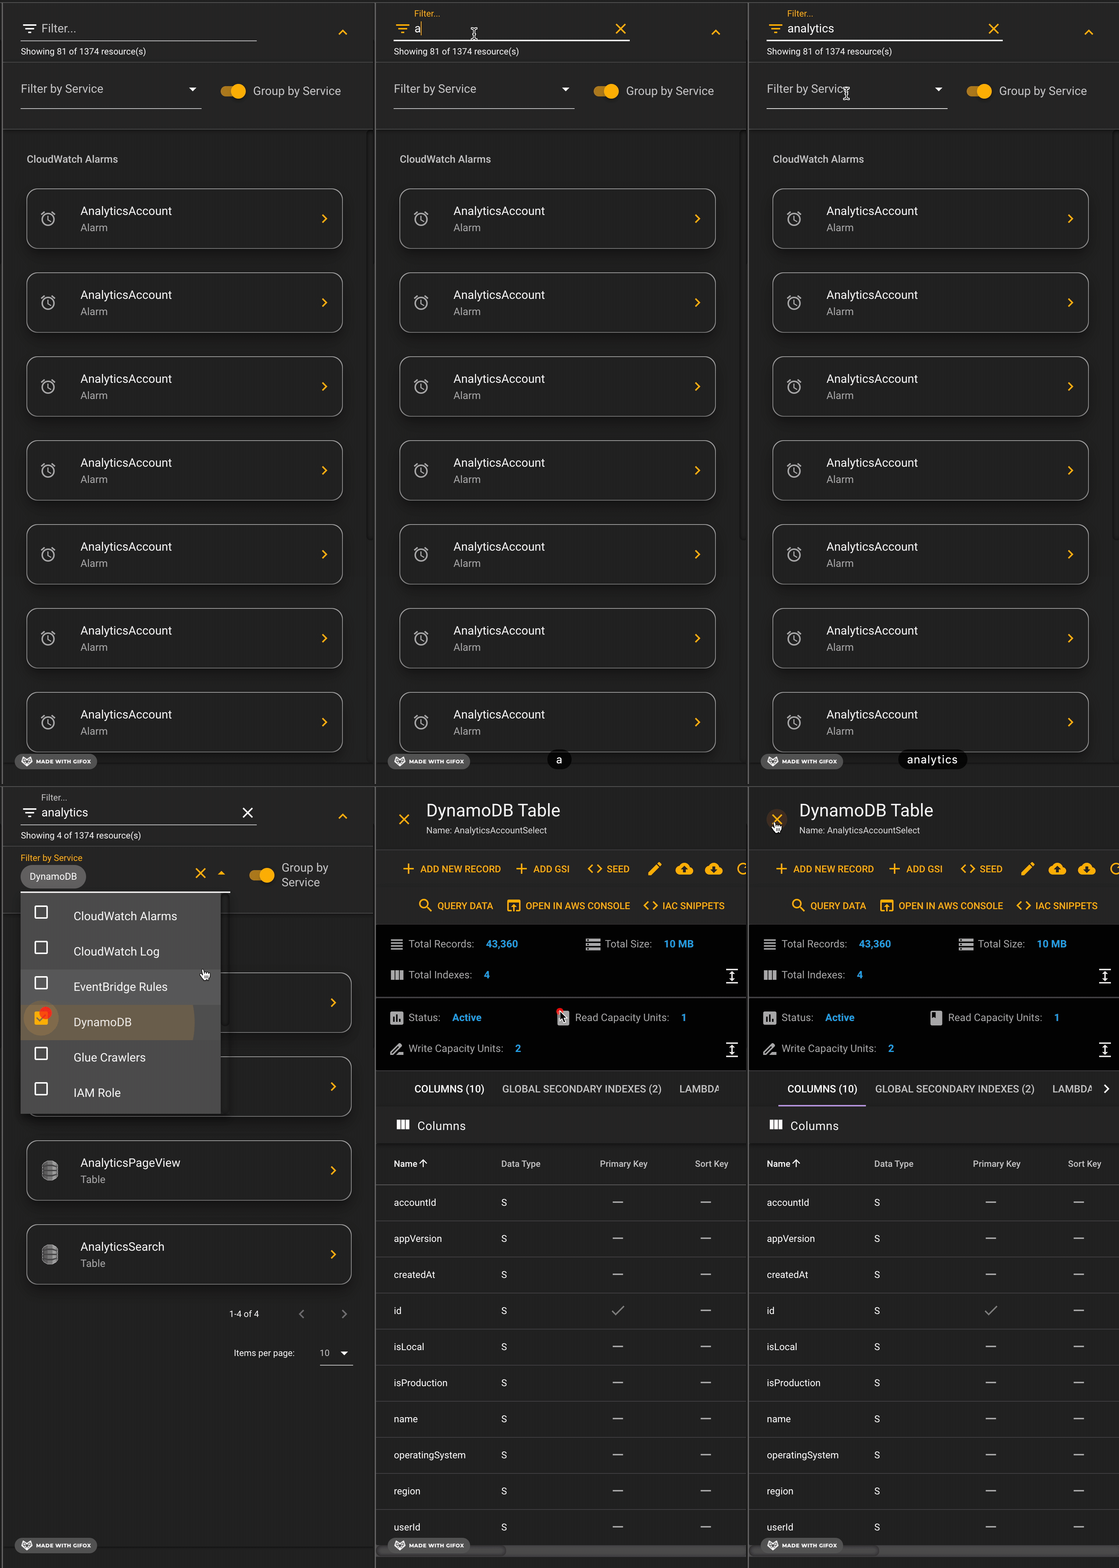
Below you can see a more detailed view of each step of this.
# Testing Revamp
We have great testing tools for being able to test connections of services to lambda. What this enables you to do is put a record or file into the service, and then view the invoked lambda's CloudWatch logs. We have support for DynamoDB Streams, S3, SNS, SQS, Step Functions, and directly invoking a lambda.
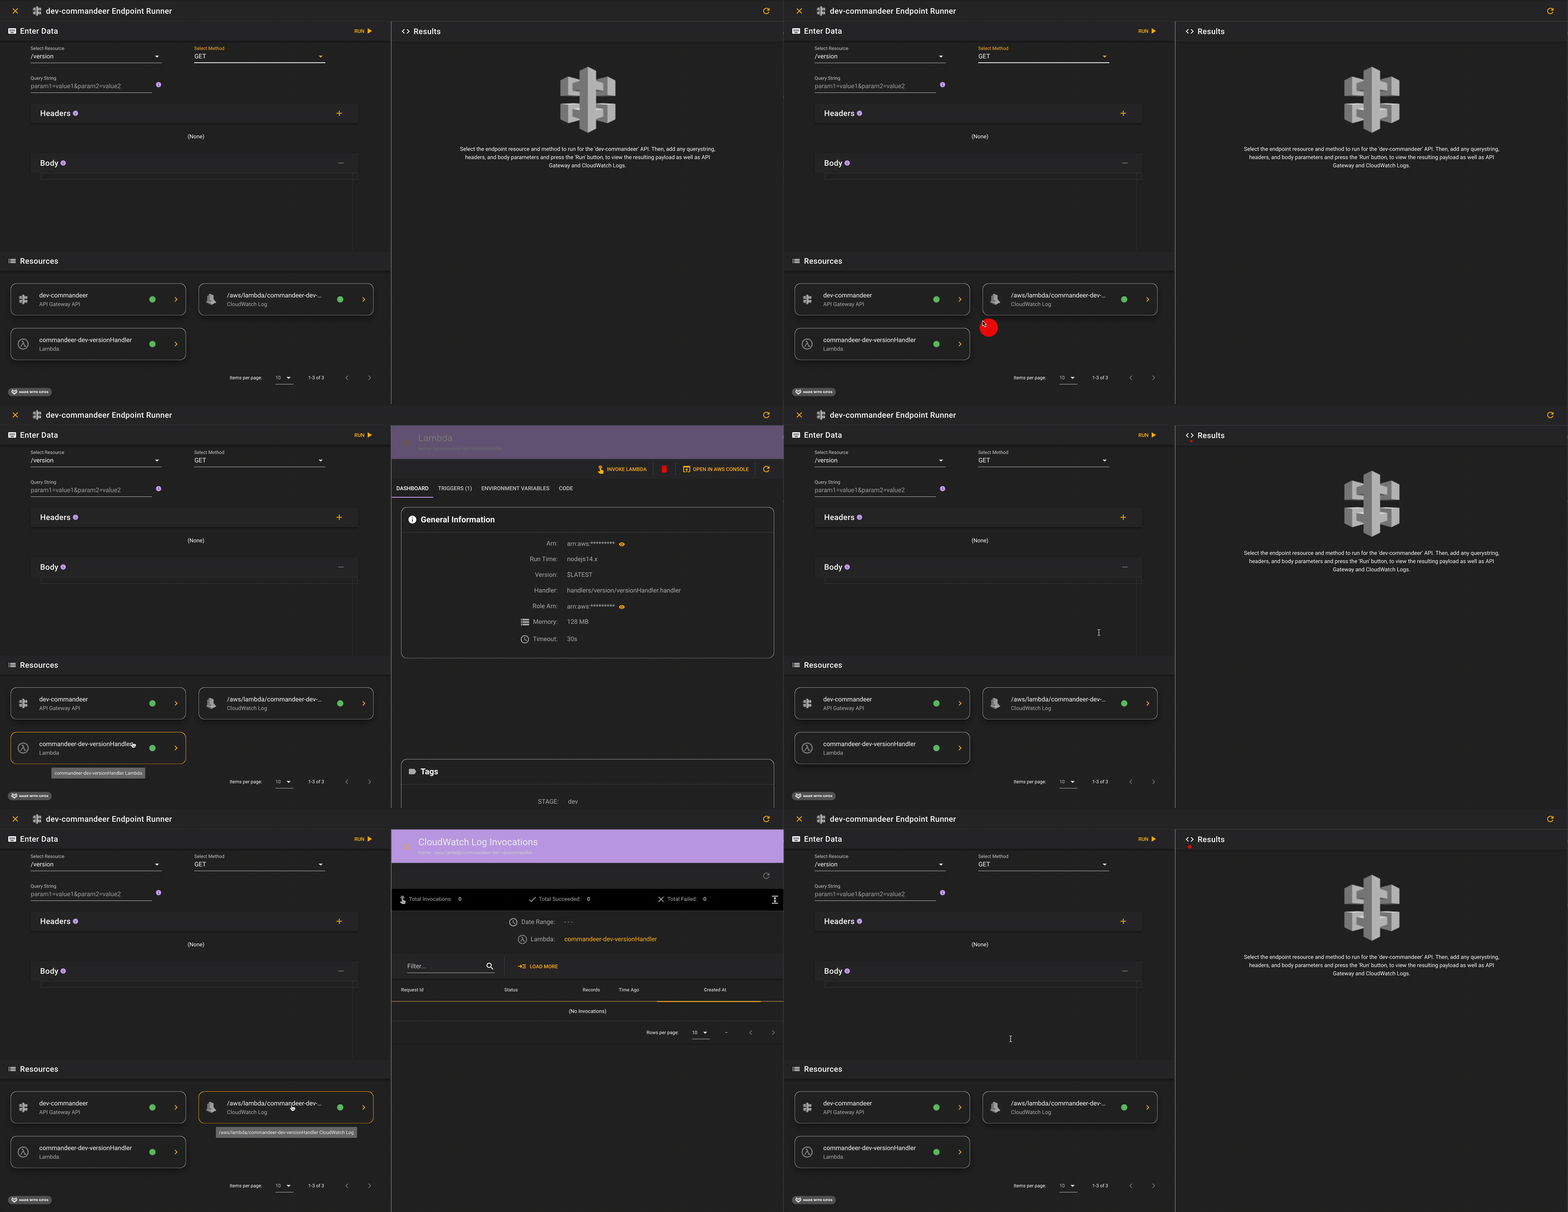
We have refined these pages, to now show the related resources. For instance, when hitting an API Gateway endpoint, you have the API that you are working on, the Lambda that is invoked, and the CloudWatch Log that it writes data to showing the bottom left hand corner. Below you can see, that using the resources section, you can click on any resource and easily see it's detailed information in the right-hand section, keeping you in context.
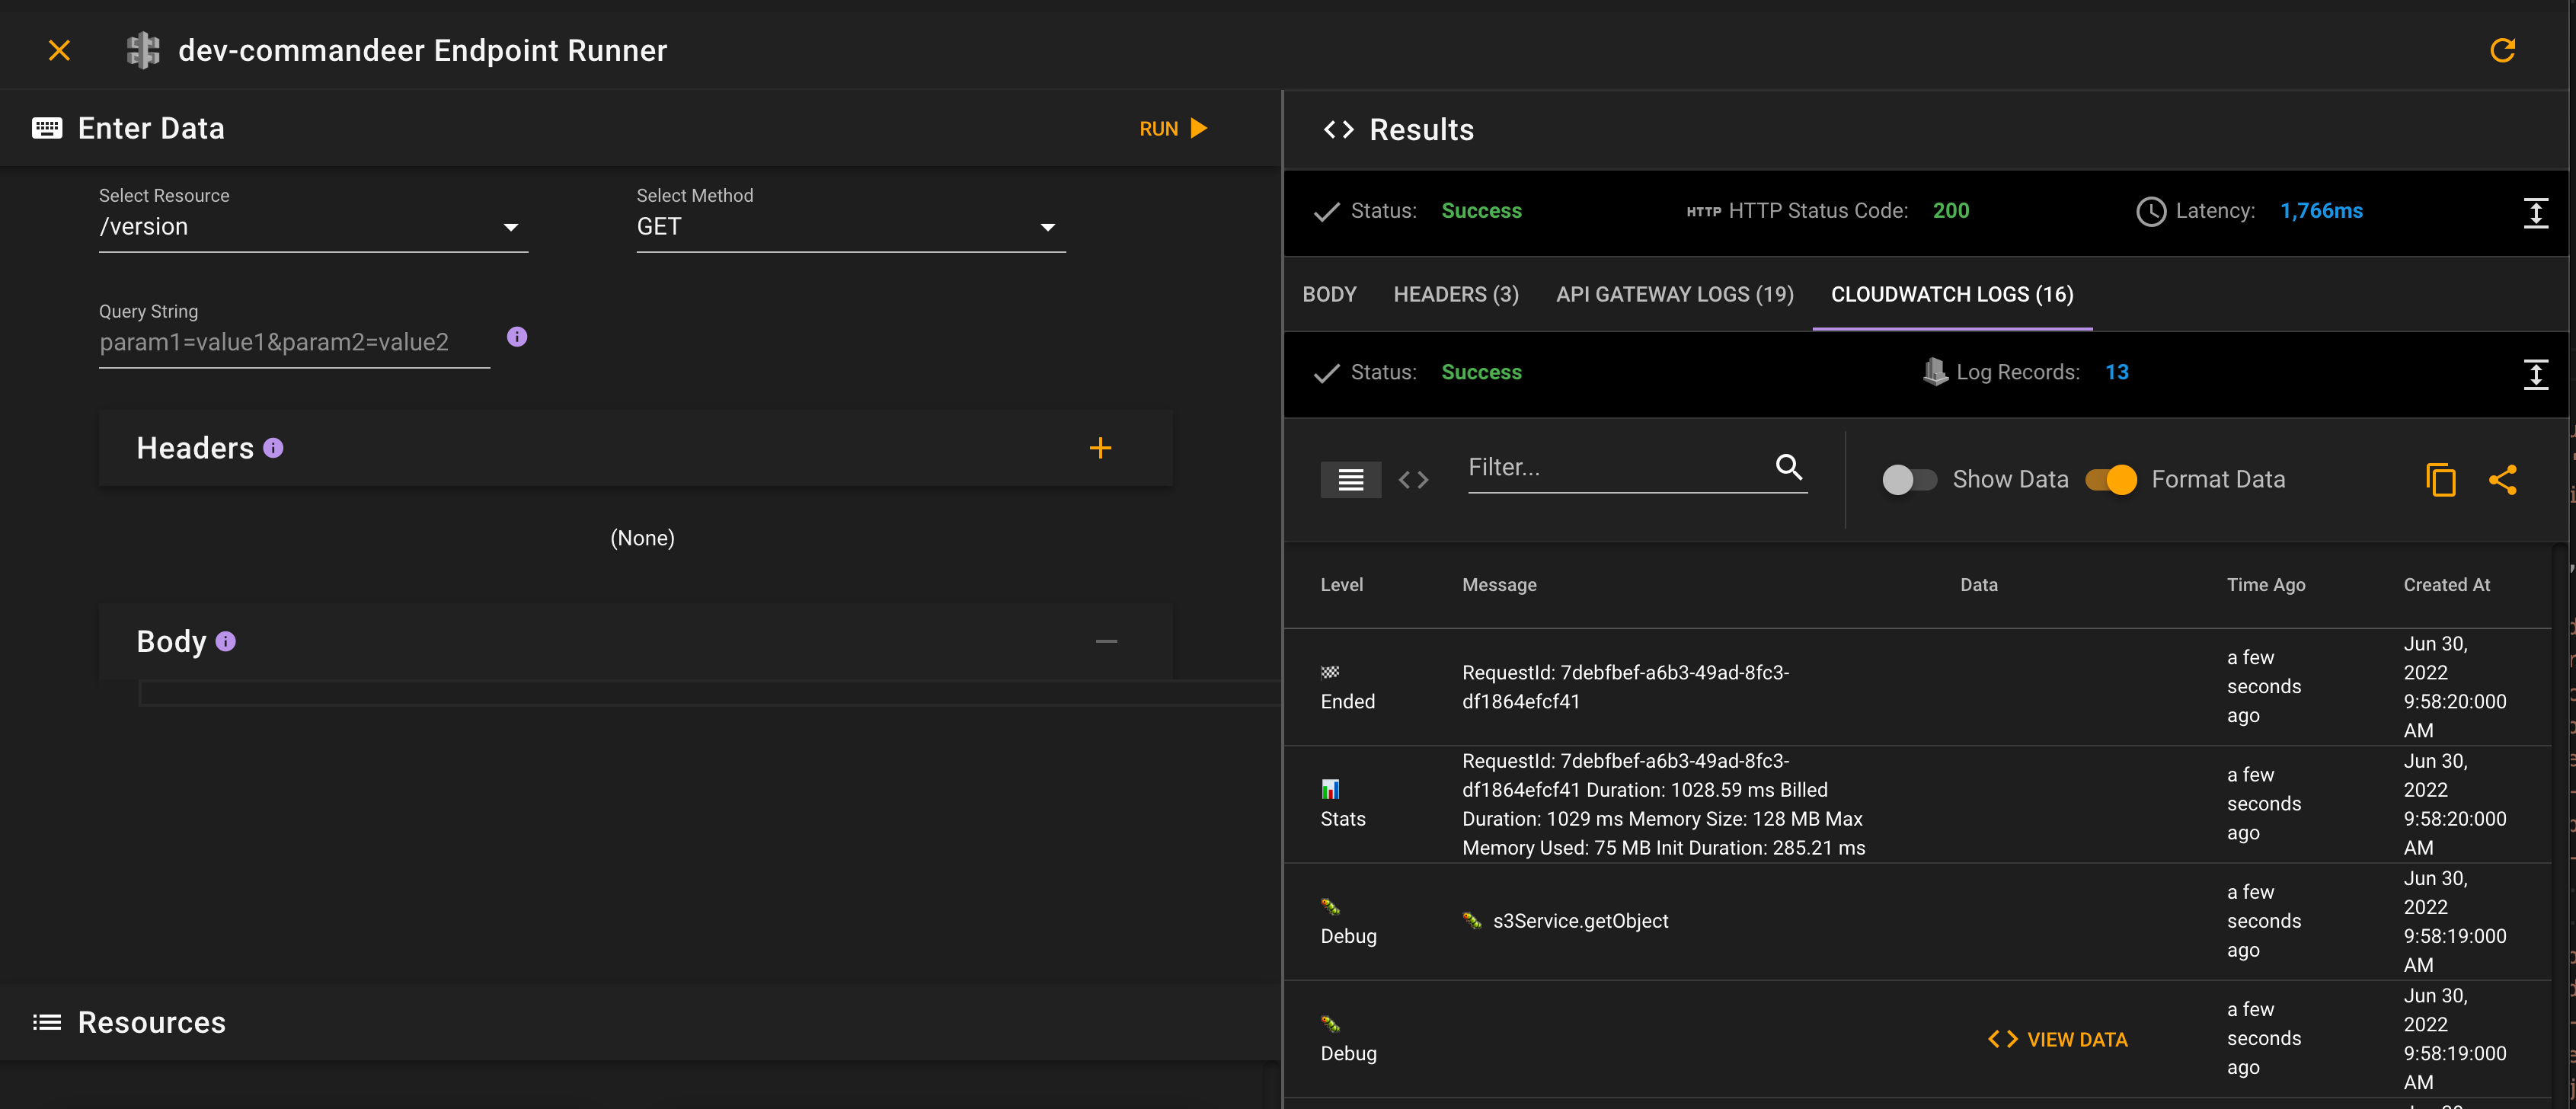
Then, when you actually want to run the event, in this case hitting the /version GET endpoint. You can see the body, header, and return status of the endpoint. But, you can also see the API Gateway logs, as well as the CloudWatch logs of the lambda invocation.
# Conclusion
We are continuing to refine the UX for Commandeer with every new release. We think that this release really solidifies the flow, so that you can get to the information you need in your account rapidly and efficiently.
