Version 1.4.0 - 10/6/2020
# Version 1.4.0 - 10/6/2020
We are busy readying our newest version of Commandeer, and it has some really exciting features we think you are going to love.
# Tabs
We are continuing to double down on the ease of use of the system for developers. In the last release, we introduced right-click menus. The next phase of this is the tabbing system. If you have been running Serverless or jumping between different tables in Dynamo, you may have noticed that tabs would be great to have. We agree, and now, moving between items is even simpler than ever. In the next few releases, we will start to have split-screen capabilities as well, so stay tuned as we make the app better and better for you.
In the meantime, here is how the Commandeer tabbing system works:
You can now see any number of services at the same time in different tabs

Every new resource opens in a new tab from the side nav
If you have a tab open for a given resource, it just navigates to the opened tab
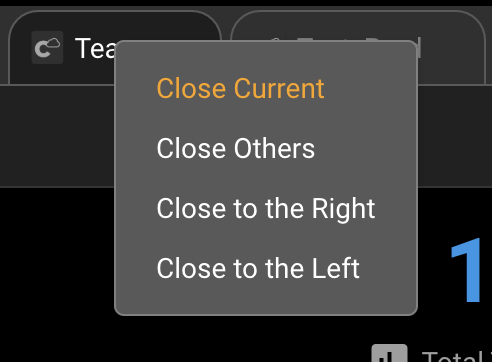
Right-click on the tab gives you a context menu allowing you to close the current tab, close other tabs, close all tabs to the left, and close all tabs to the right.

You can reorder the tabs by dragging them
You can scroll through the opened tabs too by using a mouse wheel when your mouse pointer is at the tabs area. There is also a horizontal scroll bar that appears if you mouse over the bottom separator line.

# Athena
Athena is a truly magical service. It allows you to define a schema of your data that you store in S3, and then query it with SQL. Under the hood, it is a hive database. We use it internally for all our analytics, so we have been dogfooding this tool for the last month and it is really powerful.
Stay tuned for in-depth tutorials on setting up the entire pipeline as there are a number of steps to get it humming. If you have data stored properly in a hive, you can easily run the AWS ETL Glue Crawler to automatically create your database and tables and query it all with SQL.
# Features
- Query Runner - allows you to run any SQL queries against your data
- History - view and rerun previous queries
- Favorites - favorite your queries to be able to run them easily later
- View your schema - view your tables, views, and their columns in the side treeview and dashboards
- ER Diagram - view and export your schema in an ER diagram
.png "Athena Query Runner running SELECT * FROM user")
Athena Query Runner
# API Gateway
We have added a testing suite for the API Gateway. You can set your headers and enter a body if applicable for an endpoint, and then call the endpoint.
The real beauty of the tester, is that not only can you view the HTTP status code, headers, and returning body, but you can also view the API Gateway Logs and invocation logs of the Lambda that is connected to the endpoint. If your endpoint is returning mock data, it will only return the API Gateway logs since there will not be Lambda CloudWatch logs connected.
This gives you even more powerful in the understanding of what your endpoint is doing when you call it. Below you can see the API Gateway endpoints. In the first image on the left-hand side, is your treeview of all your API Gateway Endpoints. (Note these are broken down as Resources and Methods.) The /version GET method is then selected and you can see it's information in the middle section. This particular endpoint is connected to a Lambda called commandeer-dev-versionHandler and has a 29-second timeout set.
On the left-hand side of the middle section, you can now see an endpoint runner. This allows you to add your key-value headers and a JSON body. Pressing the run button will then call the endpoint and return back to you the HTTP Status, how long it took, and whether or not it was successful based upon the HTTP statuses.
.png)
/version GET API Request against API Gateway with a Lambda Connected
It also returns back the API Gateway Logs as well as the CloudWatch Logs. Seeing the CloudWatch logs here is very helpful when debugging an endpoint. This is not meant
.png)
# DynamoDB
- Fixed the data uploader
# SNS
- added a System Diagram
# SQS
- added a System Diagram
- ability to create a queue
- ability to delete a queue
# Onboarding
We have streamlined onboarding for new users a bit. Now you will simply log in with your SSO to get started.
