Lambda Testing Suite
... About 6 min
# Lambda Testing Suite
The Commandeer Lambda testing suite allows you to test your lambda's in a whole new way. You can test out the system you have, both by direct invokes on lambdas, as well as by invoking them via API Gateway, DynamoDB, S3, SNS, SQS, or Step Functions. For example, you can drop a file into S3 and view the resulting CloudWatch Logs of the invoked Lambda.
# Lambda Invoke Tester
For many cases, you might want to just be able to test a Lambda directly. This is where our Lambda Invoke tester comes in. You can select the 'Invoke Lambda' menu item for a particular Lambda, as you can see below.

# Successful Invocation Example
Clicking on the Invoke Lambda from either the side navigation as shown above or on the Lambda detail page will present you with the Lambda Invoke page like below.

The left-hand side allows you to pass in the json Payload and Client Context for the lambda. The payload is like passing in parameters for the lambda to work with. The Client Context is also sometimes used by developers when chaining lambdas together, to be able to provide further information about the context of the request. Once you have these ready, you can press the 'run' button to actually invoke the lambda. Below you can see information entered for both the Payload and the Client Context.

The first thing you will see when you run it is the overall status of the lambda. This also shows the Http Status that is returned. You will also see information like the request id in the general information section. Lastly, you will see any data returned in the body of the payload.

On the second tab, you can see the associated CloudWatch logs for the invocation. These can be particularly helpful when you are trying to debug what the issue might be with your system. Below you can see the detailed information that was logged in CloudWatch.

We detect if there was not only an error reported by the context.fail or a thrown error, but we also detect errors within your CloudWatch logs.
# Failed Invocation Example
Many times while testing it will be because of a failure. In this example, we are going to pass in some invalid json to the lambda, but you will often have cases where your code is causing the crash. Below you can see the we have some JSON that is incorrect.

Once you run this, the results will tell you what is wrong.

# API Gateway Lambda Tester
API Gateway is a great tool for creating an API that your frontend products or customers can use. Much of the internet is powered by API's. Up until now testing them was a bit difficult for backend developers. While tools like Postman and Paw are amazing and provide a really great way to see the resulting body and headers from your API calls, they are lacking in two ways.
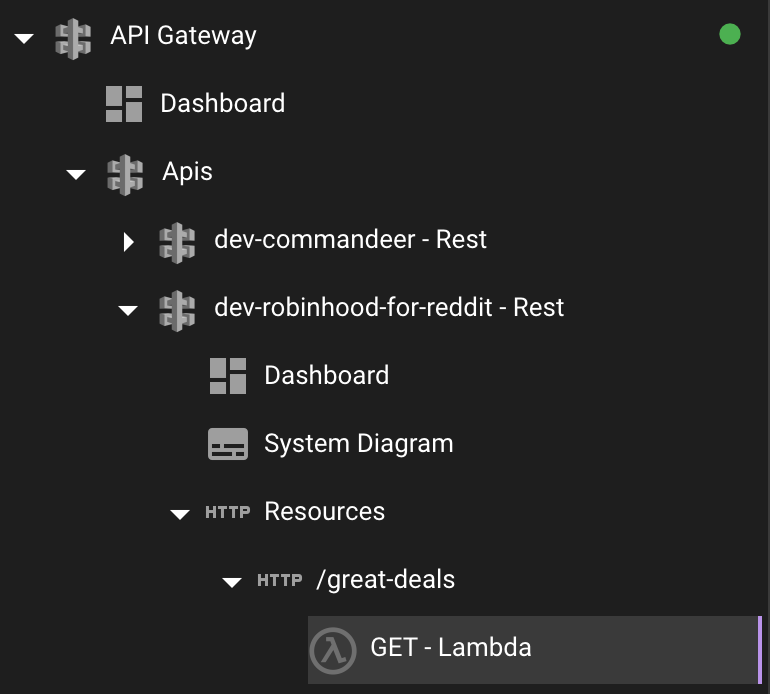
First, you can only see the endpoints you specify. If you don't create the collections, your endpoints are unknown. Whereas, in Commandeer, because you are directly connected to your AWS environment. You can see all your endpoints immediately. Below you can see an example of this with our Gamestonks sample api.
Secondly, they treat the backend as a black box. In our example above, you have the endpoint
which will bring back your body and header information. But, from this you can not really tell that it is a Lambda behind the scenes, and you can't see logs from the API Gateway and CloudWatch Logs that are connected to the Lambda.
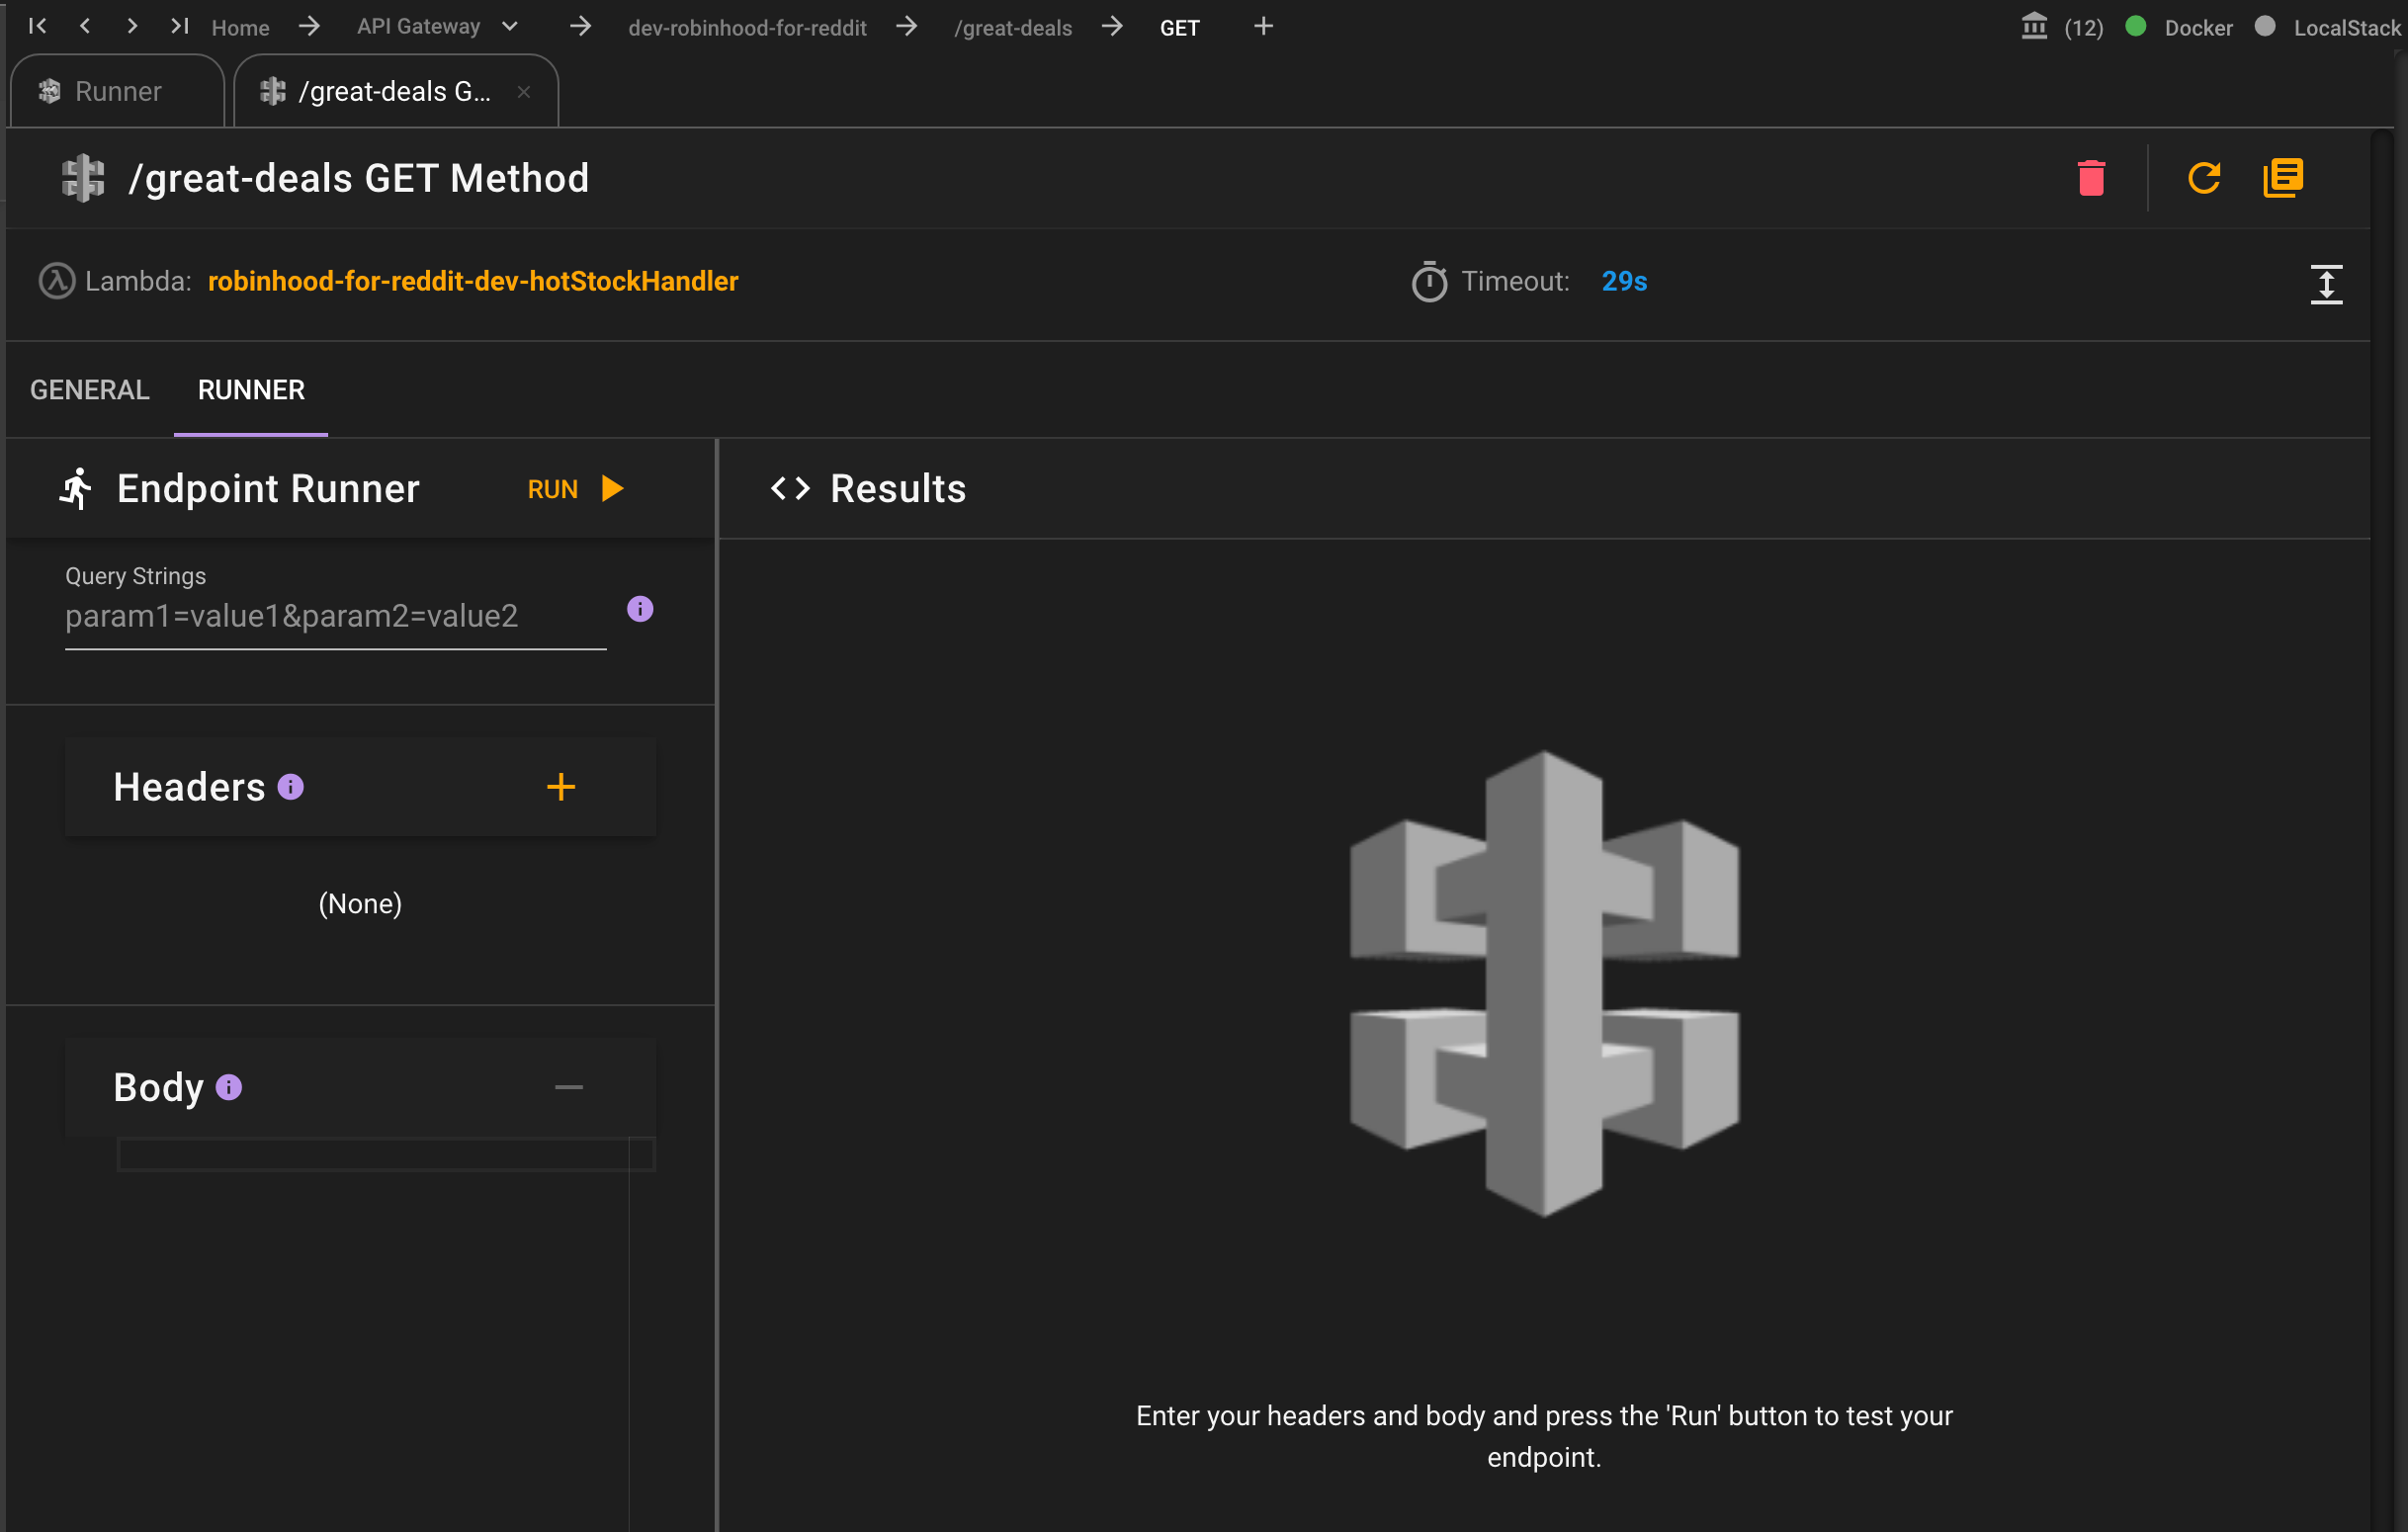
That is until now. In our runner, you can enter any information like querystring parameters, request headers, and body in the right hand side.
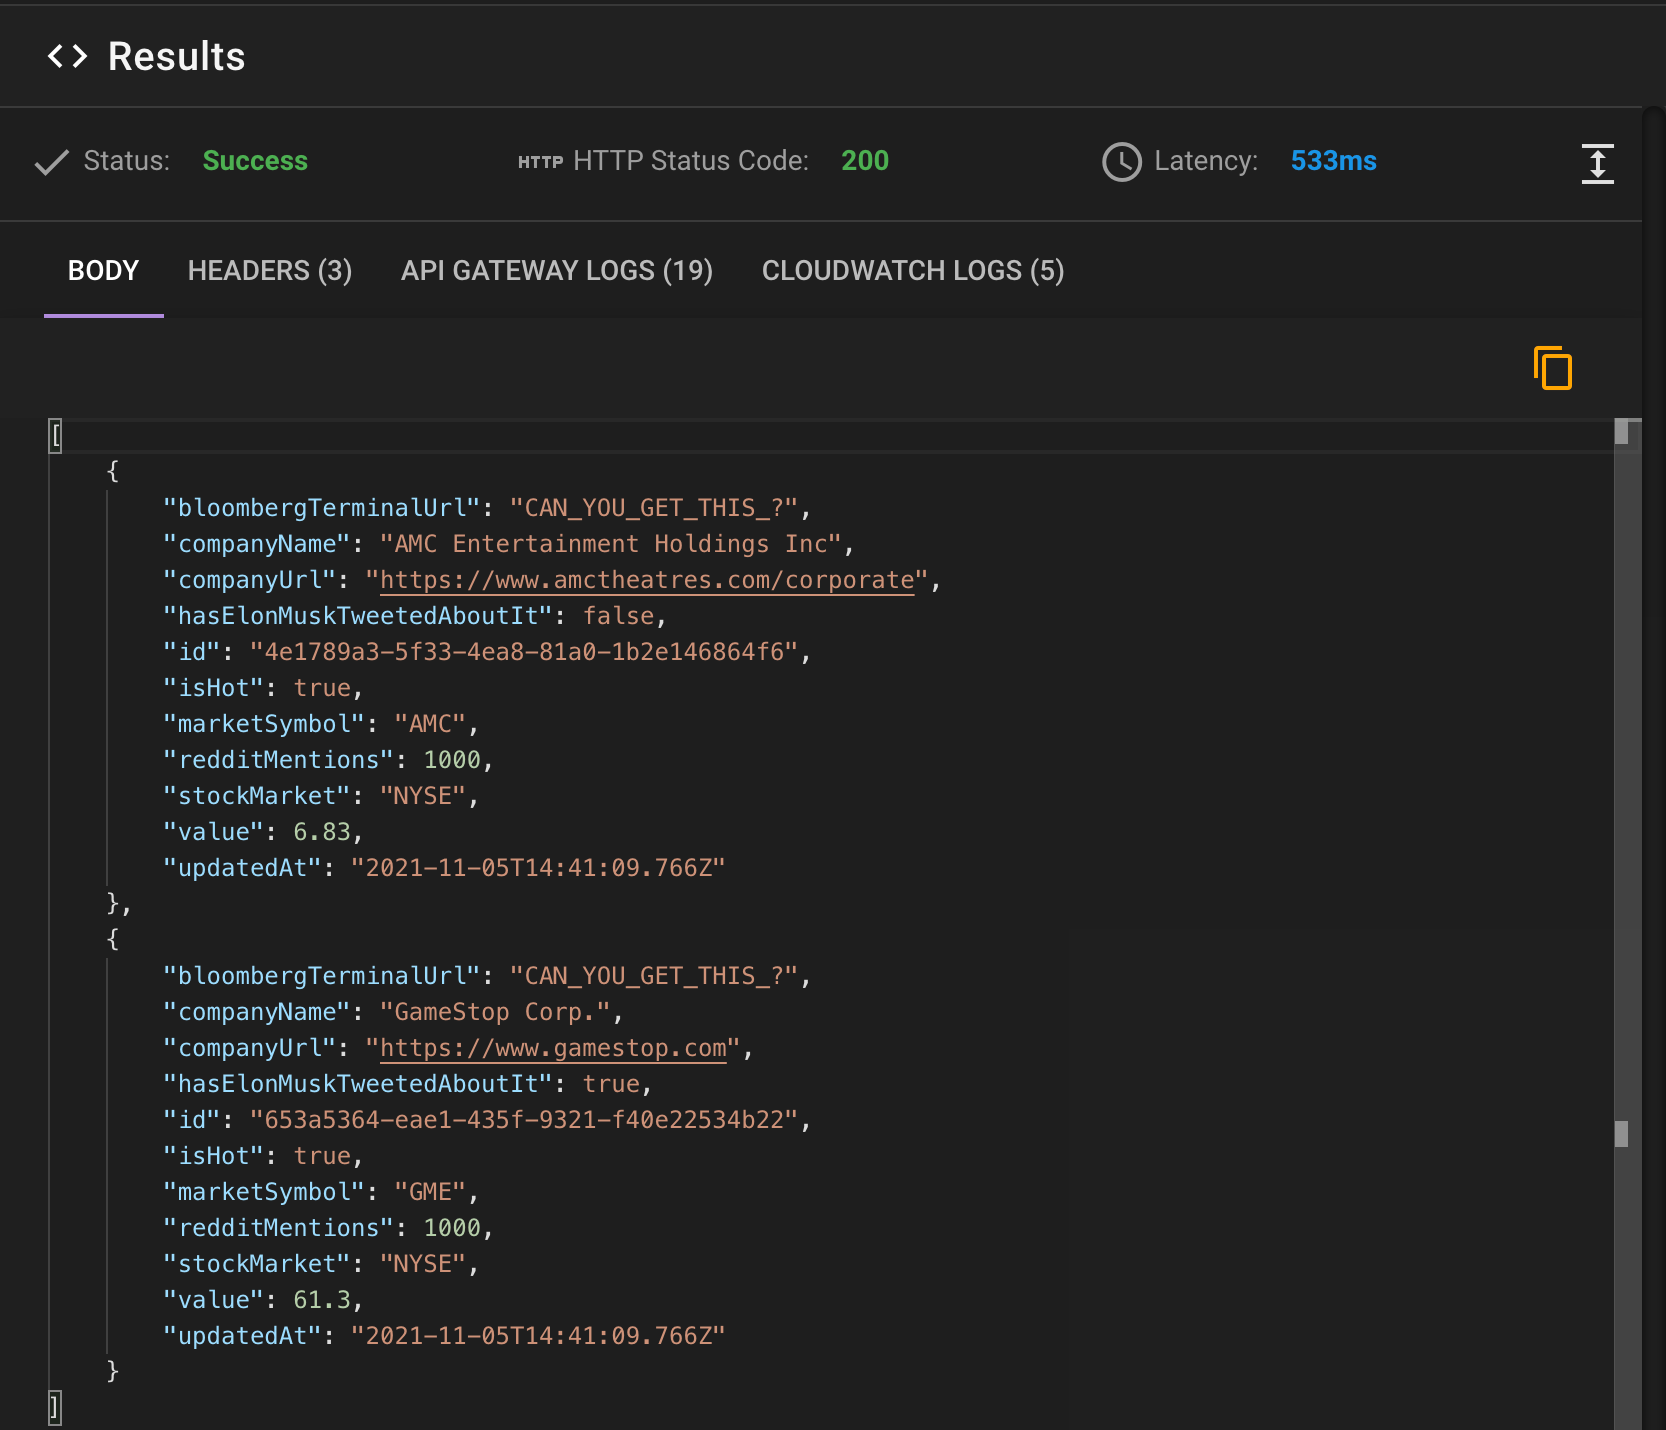
And then when you run the query, it will return back to you a lot of important information.
First you will see the overall resulting status, the HTTP static code, and how long it took to run, and the body of the response.
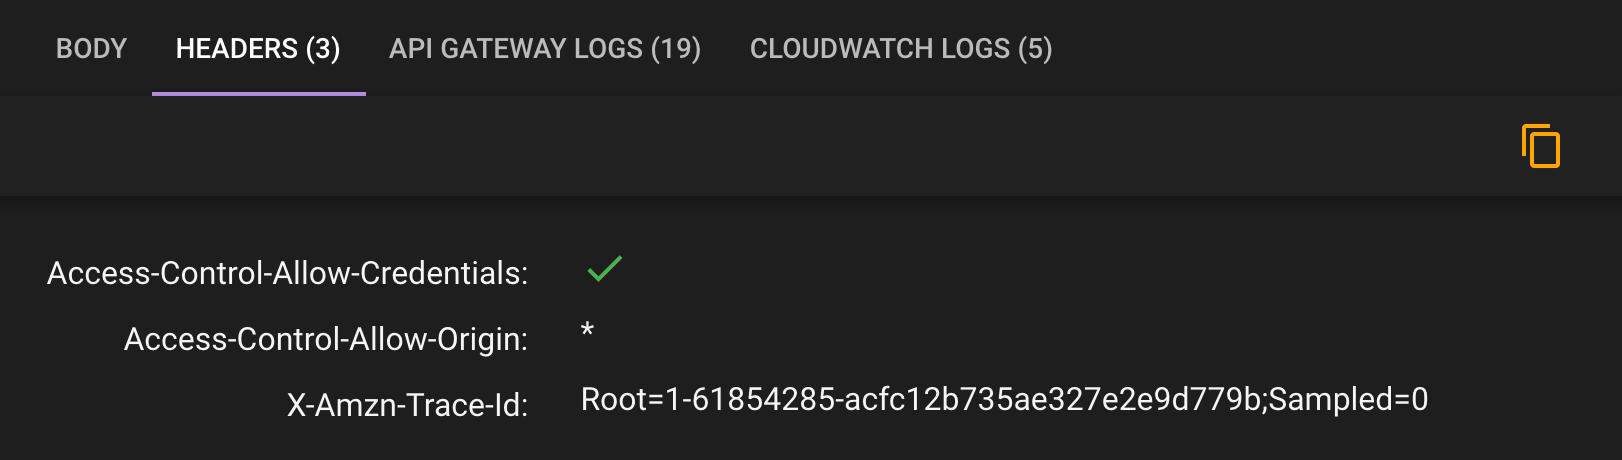
Then, like in Postman and Paw you can see the headers.
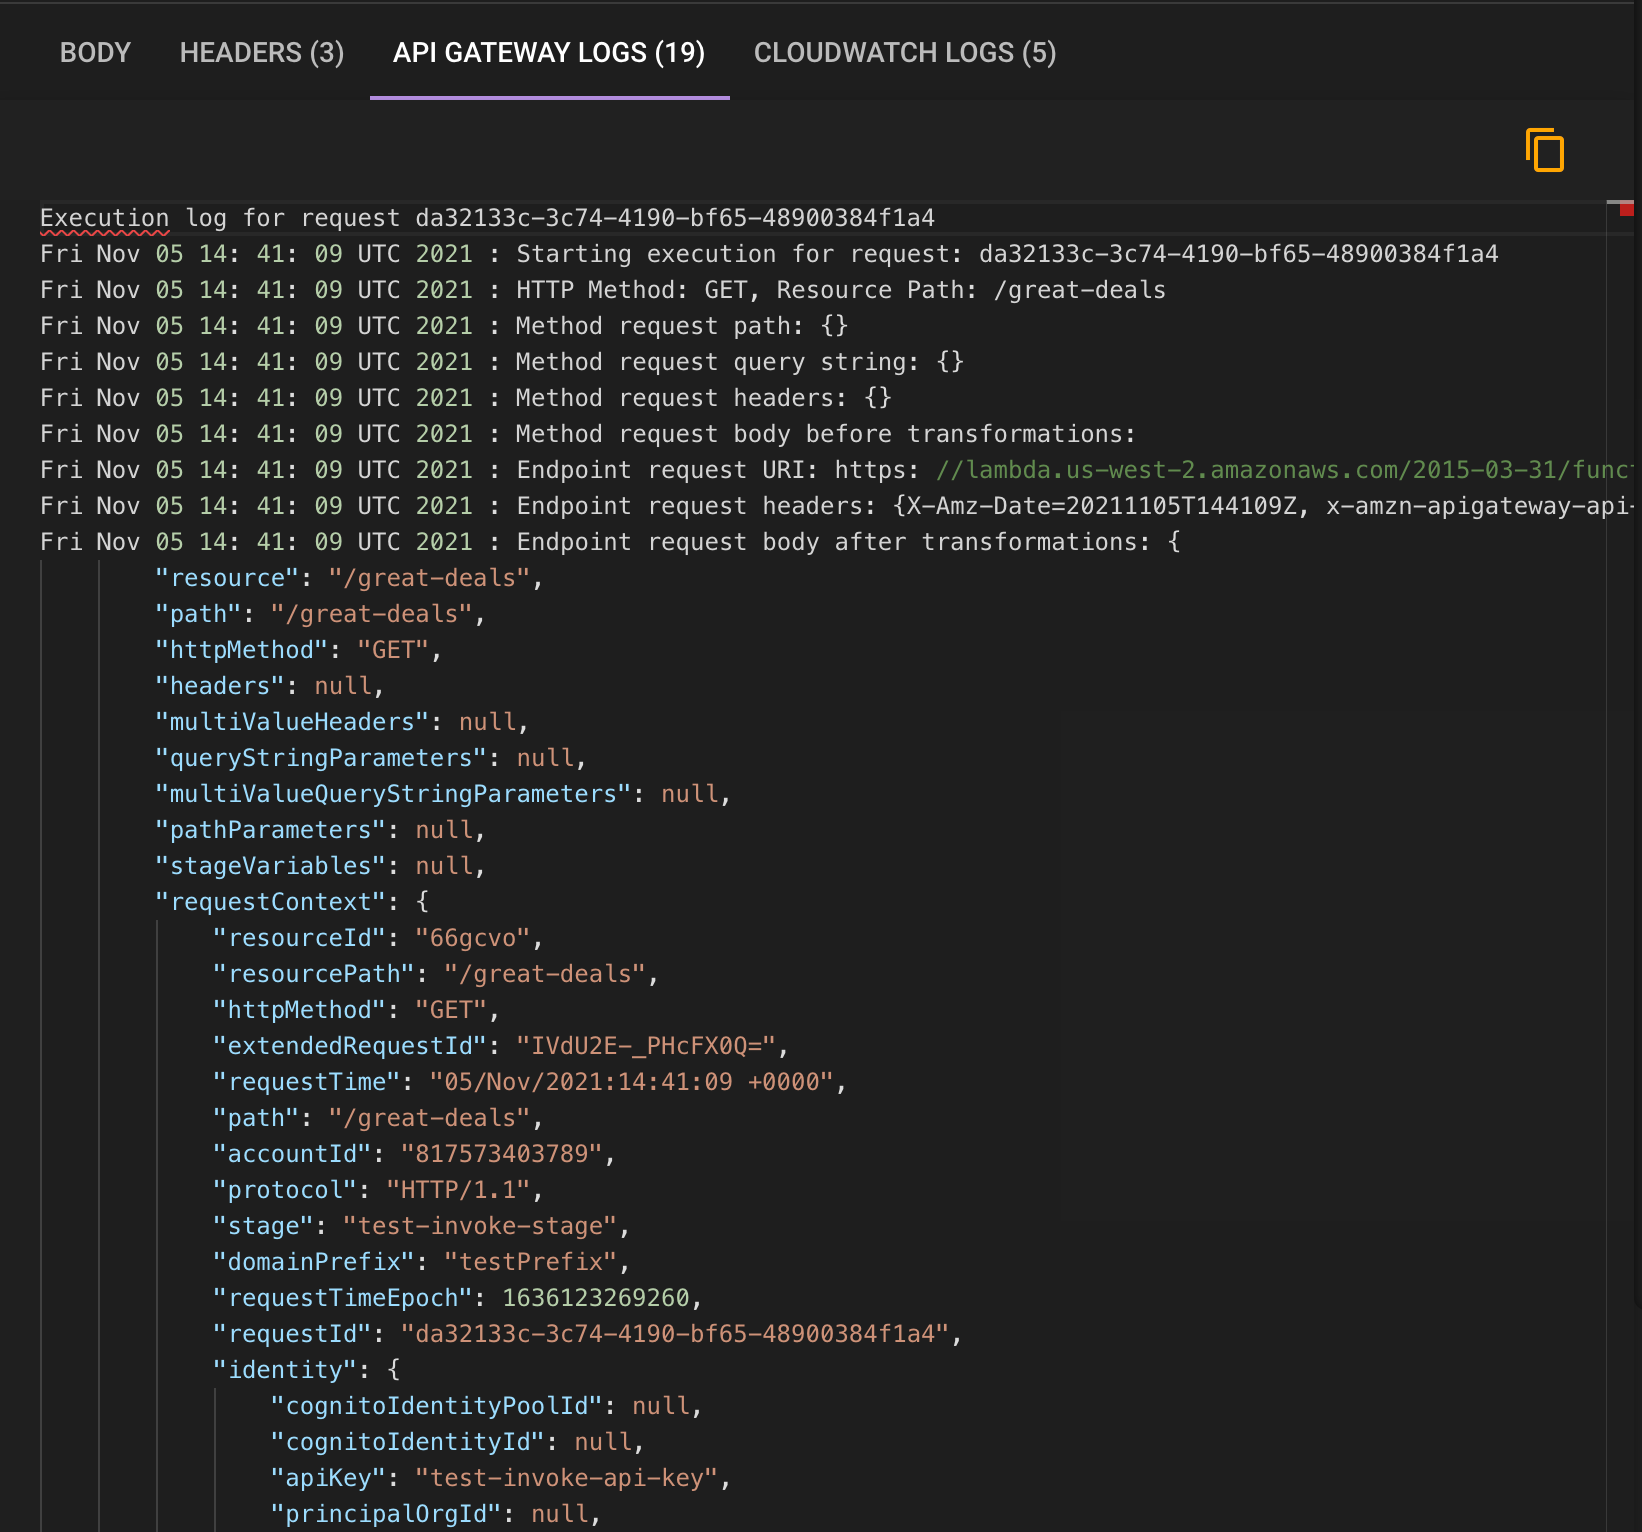
But now, this is where it gets interesting. You can now see the API Gateway Logs for the actual request.
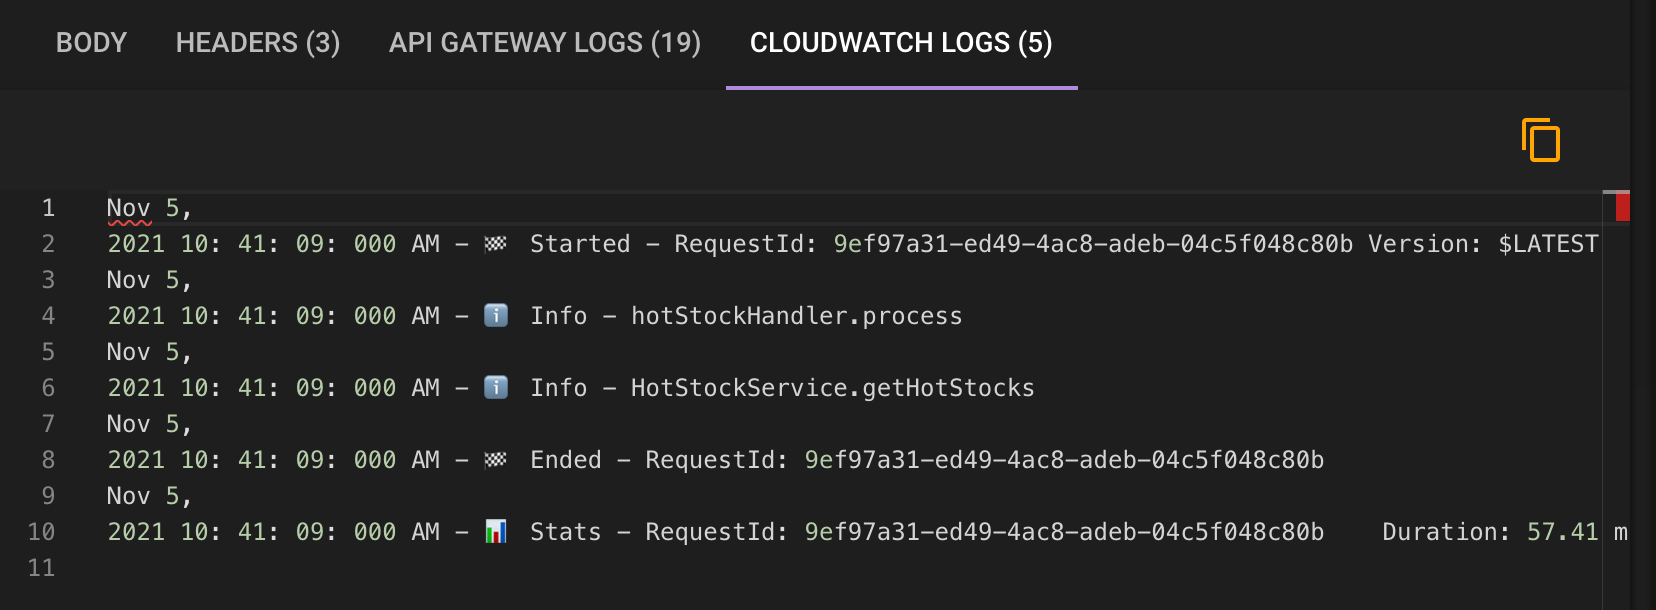
And finally, if your endpoint is connected to a Lambda to bring back results, your can see the CloudWatch Logs of the Lambda.
This is huge for not only testing our your endpoints, but debugging issues with endpoints that have crashes.
# DynamoDB Stream Lambda Tester
This tester allows you to add a record to a Dynamo DB table and then watch the results of the lambda invocation that is connected to it via a Dynamo Stream. DynamoDB Streams are used when you want to have some piece of logic in a lambda run every time data is inserted, updated, and/or deleted in your DynamoDB table.

Clicking on the 'Test Stream' button takes you to the tester page. Below you can see the page.

At the top. it shows you the connection of the 'Lead' table to the 'commandeer-dev-leadStreamHandler' Lambda which in turn is connected to the 'commandeer-dev-LeadStreamHandler' CloudWatch Log.
On the left-hand side you can see that there is a place to add json that will be saved to the DynamoDB table. We infer columns within Commandeer based on existing data and indexes of your table, so we help you by pre-populating this section. But you can always change it to whatever you want, as it is freeform json, which is one of the beauties of NoSQL. Here you can see we have setup our data how we want it for this test.

Once you run this, you will see the results of the CloudWatch Logs as shown below.

# S3 Lambda Tester
The Lambda S3 Tester allows you to upload a file to an S3 bucket that is connected to a Lambda on the other end. You can then view the results of the lambda invocation. Below you can see that the 'test1-commandeer' bucket is connected to the 'demoHandler' lambda.
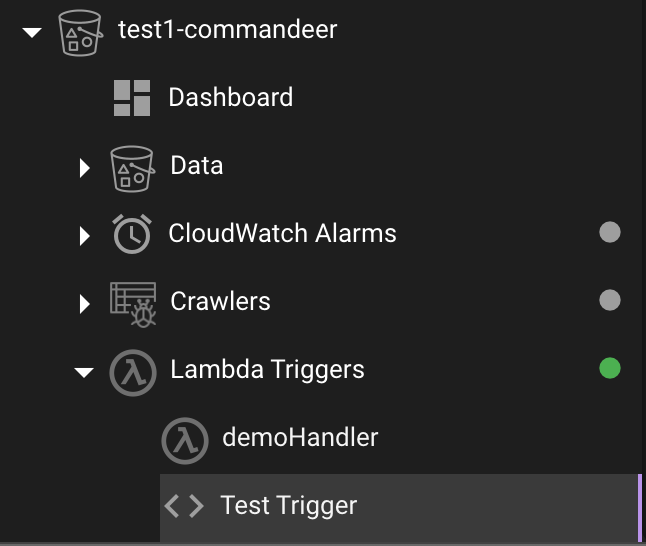
Clicking the 'Test Trigger' item will take you to the testing page.
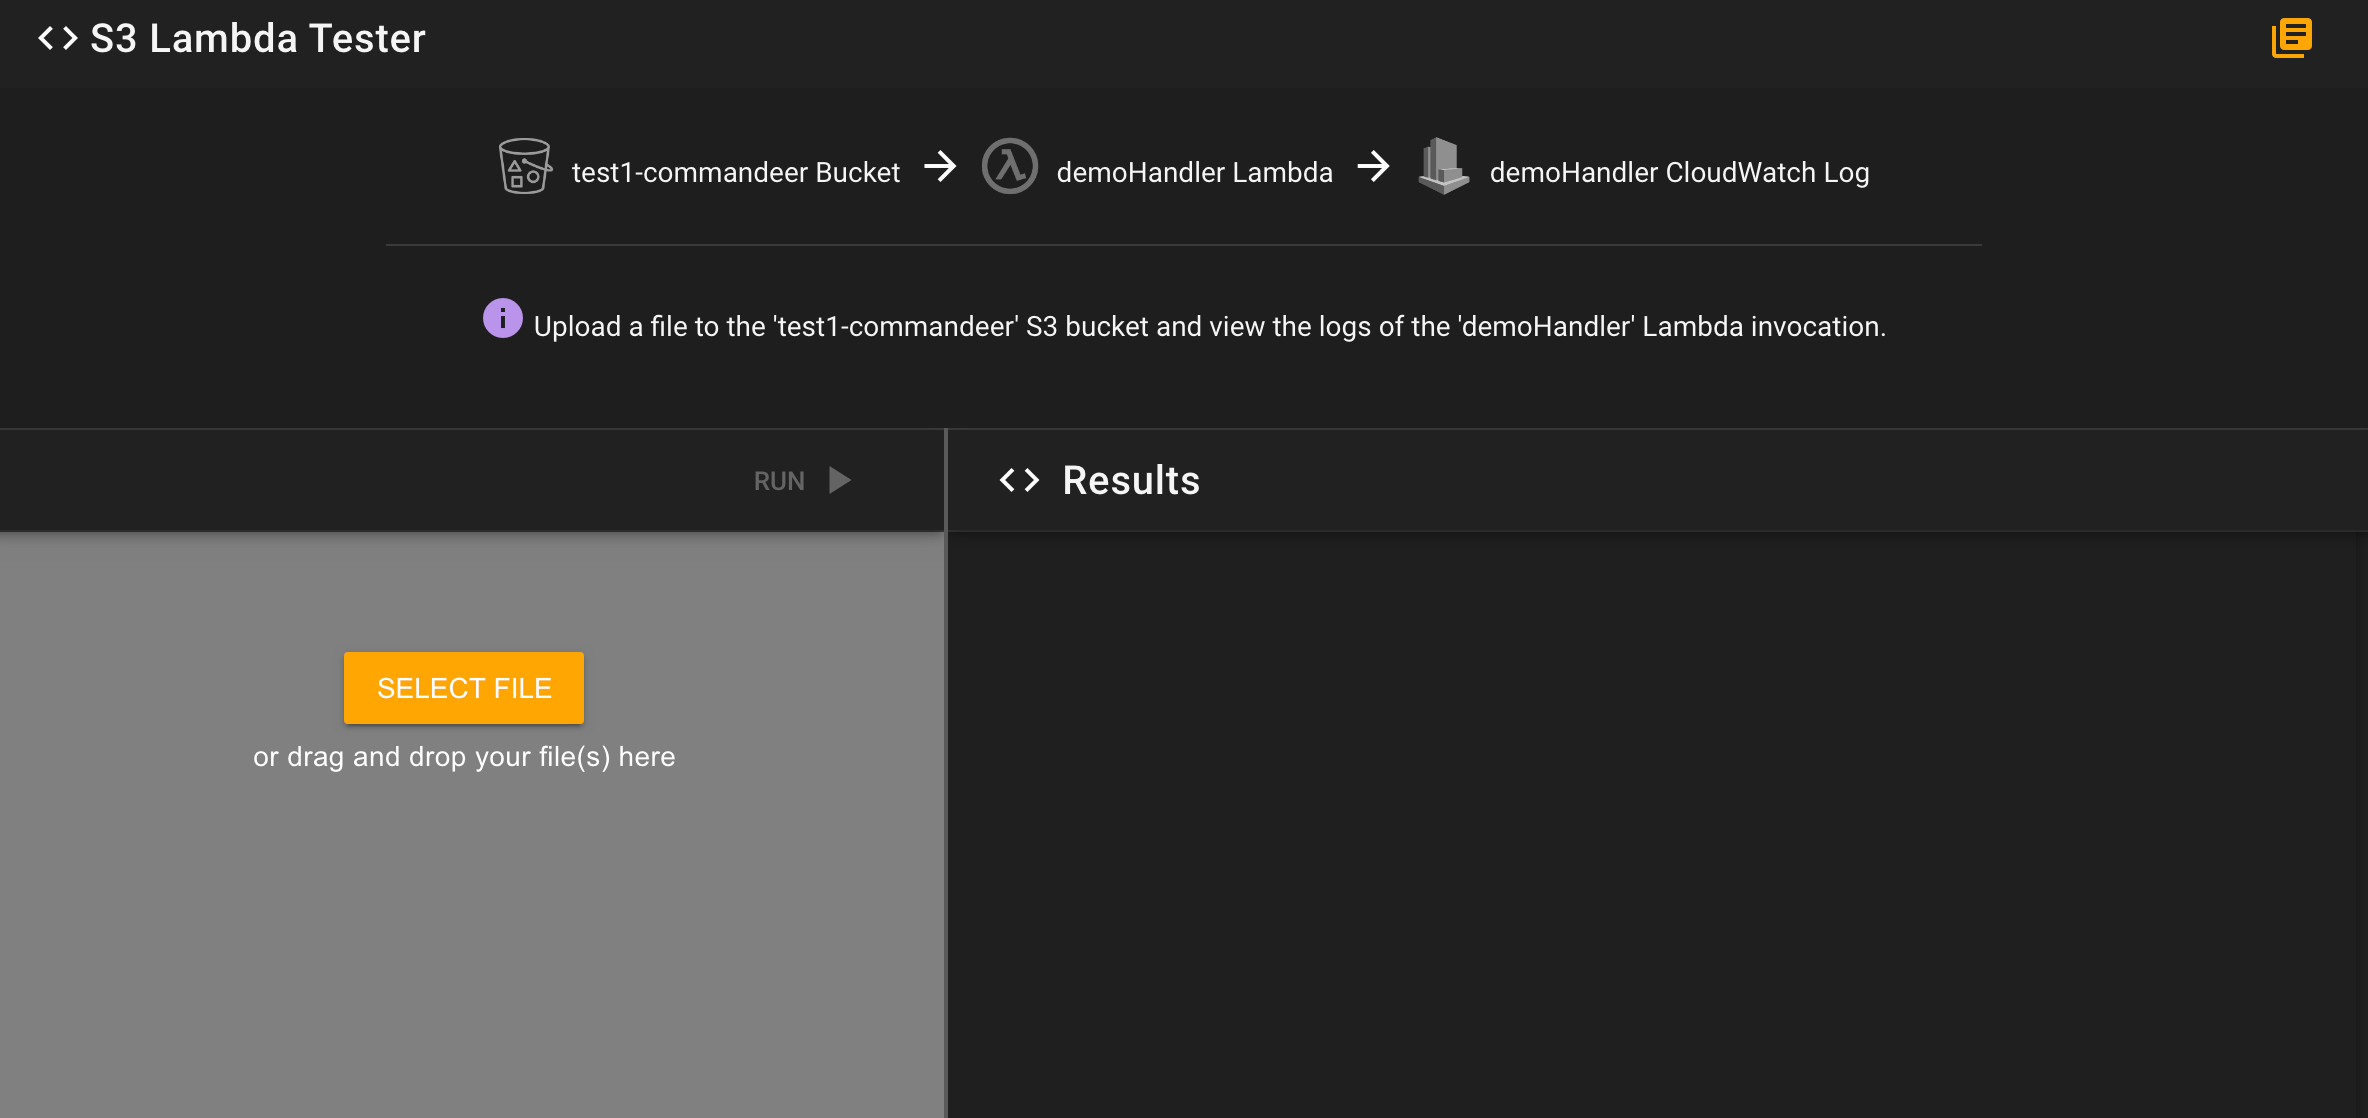
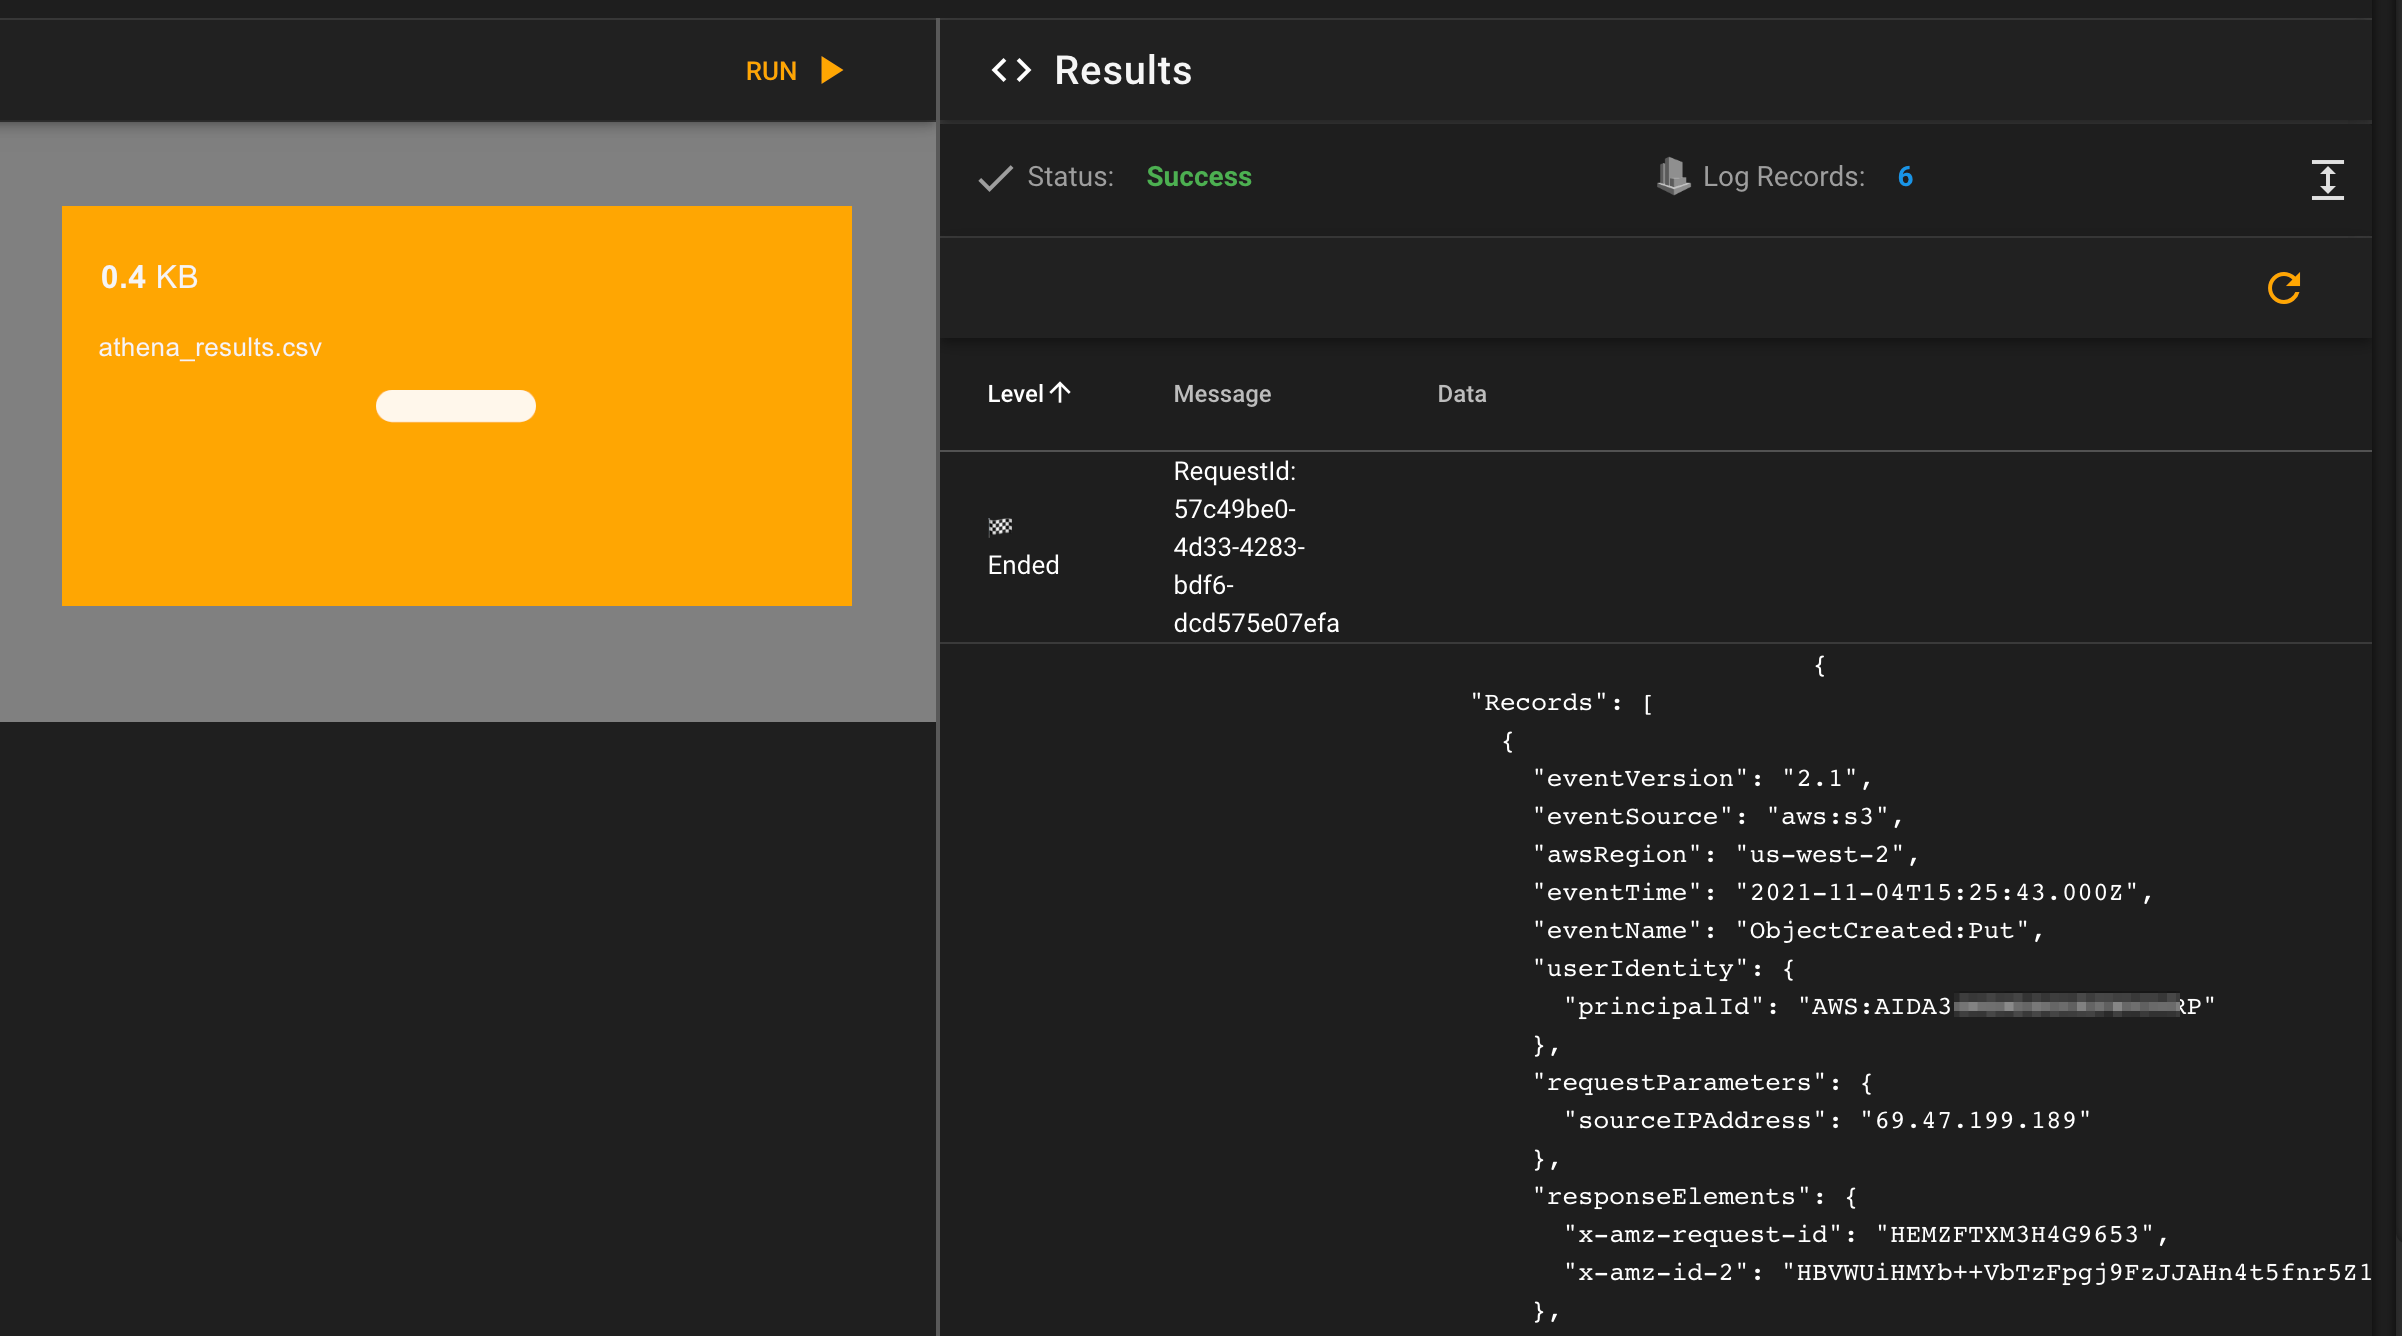
On here you can add a file on the left hand side, and then click run to view the results of the invocation. In this case, we upload a csv file and then see the logs of the invocation.
# SNS Lambda Tester
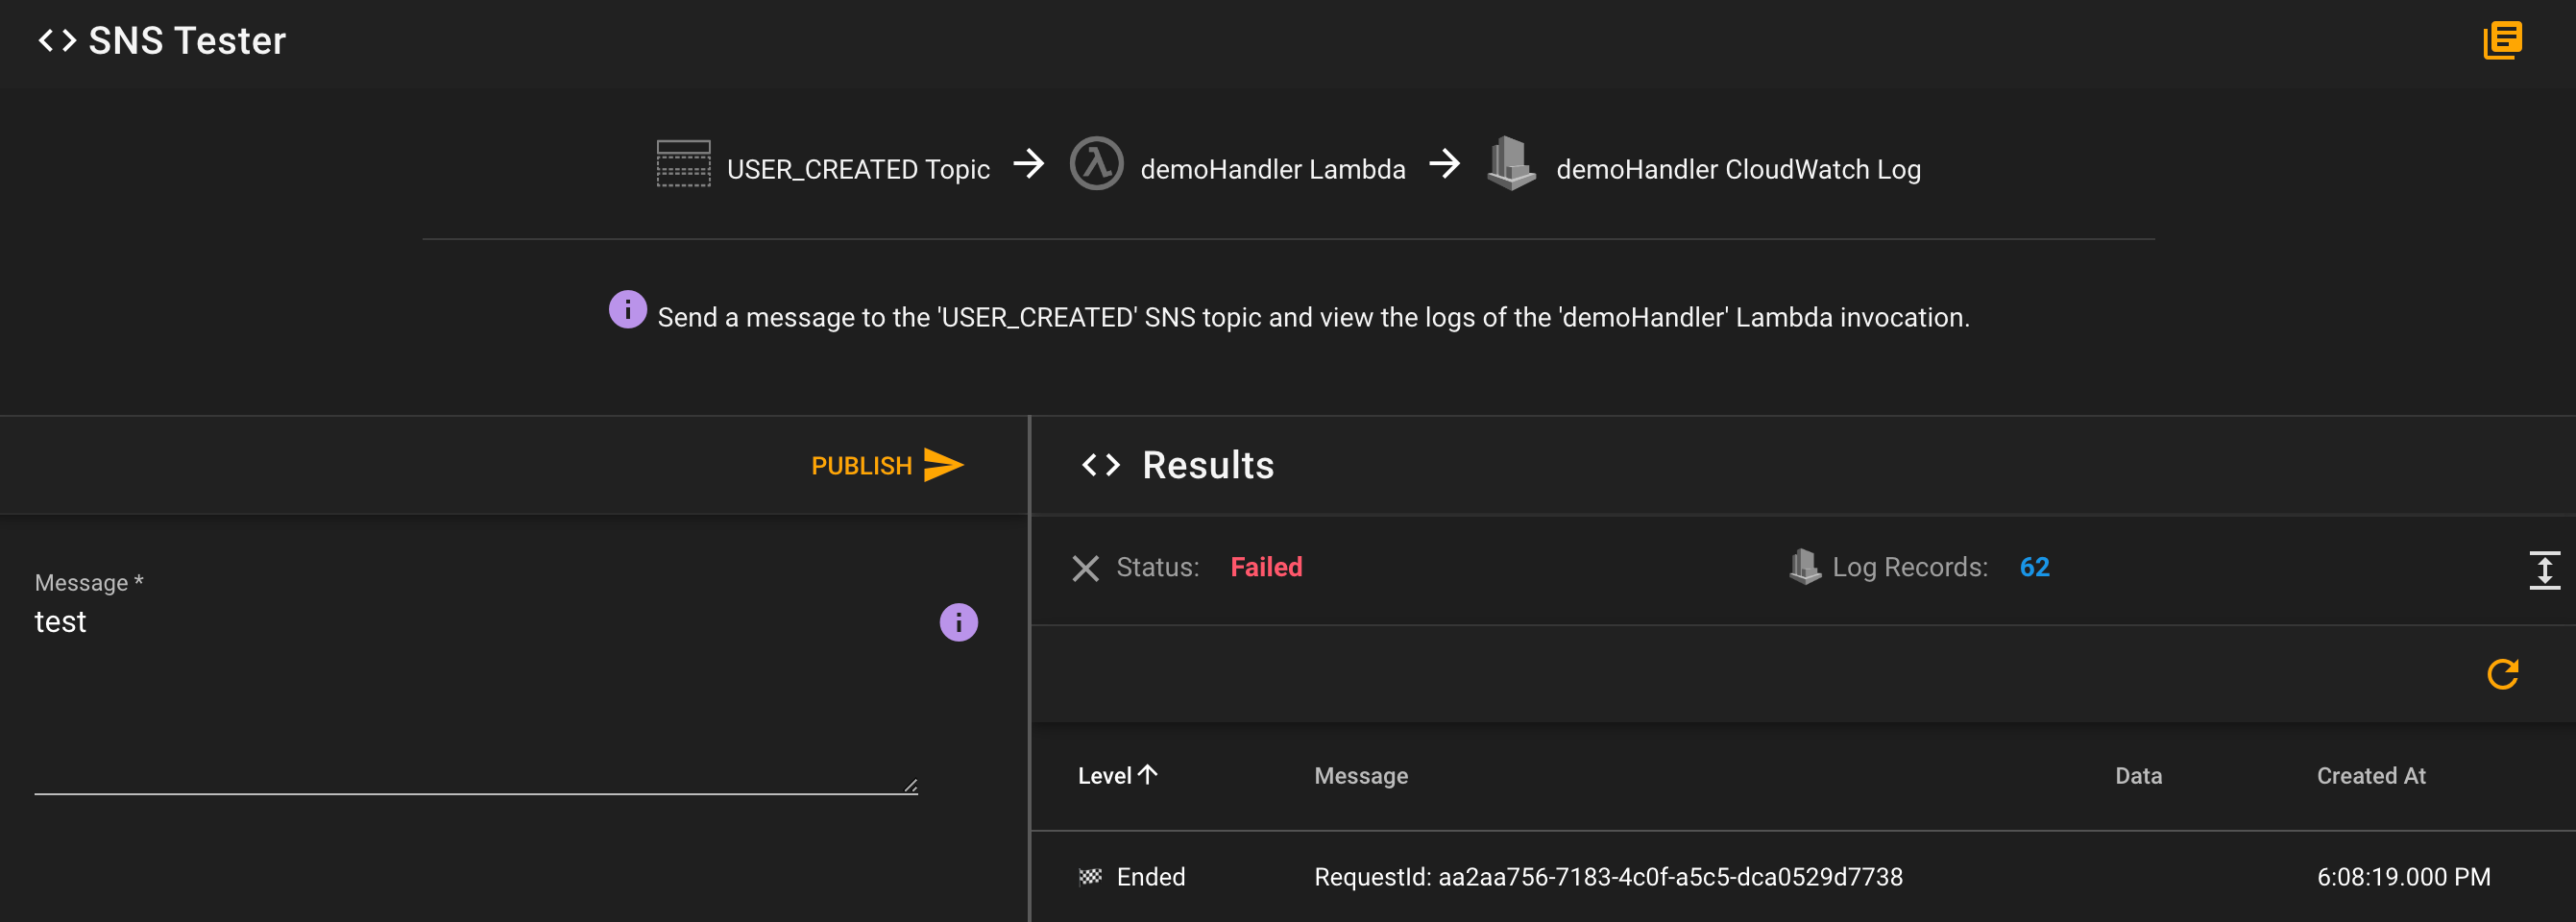
The Lambda SNS Tester allows you to send a message to an SNS topic that is connected to a Lambda on the other end. You can then view the results of the lambda run. Below you can see an example of a failed run where the message passed into the Topic is 'test' and then on the right you can see the resulting CloudWatch Logs.
# SQS Lambda Tester
The Lambda SQS Tester allows you to add a message to an SQS queue and view the logs of the Lambda invocation. Below you can see an example of sending a JSON message to the queue and then viewing the resulting CloudWatch Logs from the invocation.

# Step Functions Lambda Tester
Step functions allow you to string together multiple Lambda's as well as SQS Queues, choices, and other tasks to create a business logic pipeline.
While creating them is great, as you can use configuration files to specify how the logic works, testing them in an easy way can be a challenge. We provide a simple way to test out your step functions and debug issues you might encounter with them. Below you can see our State Machine Runner.
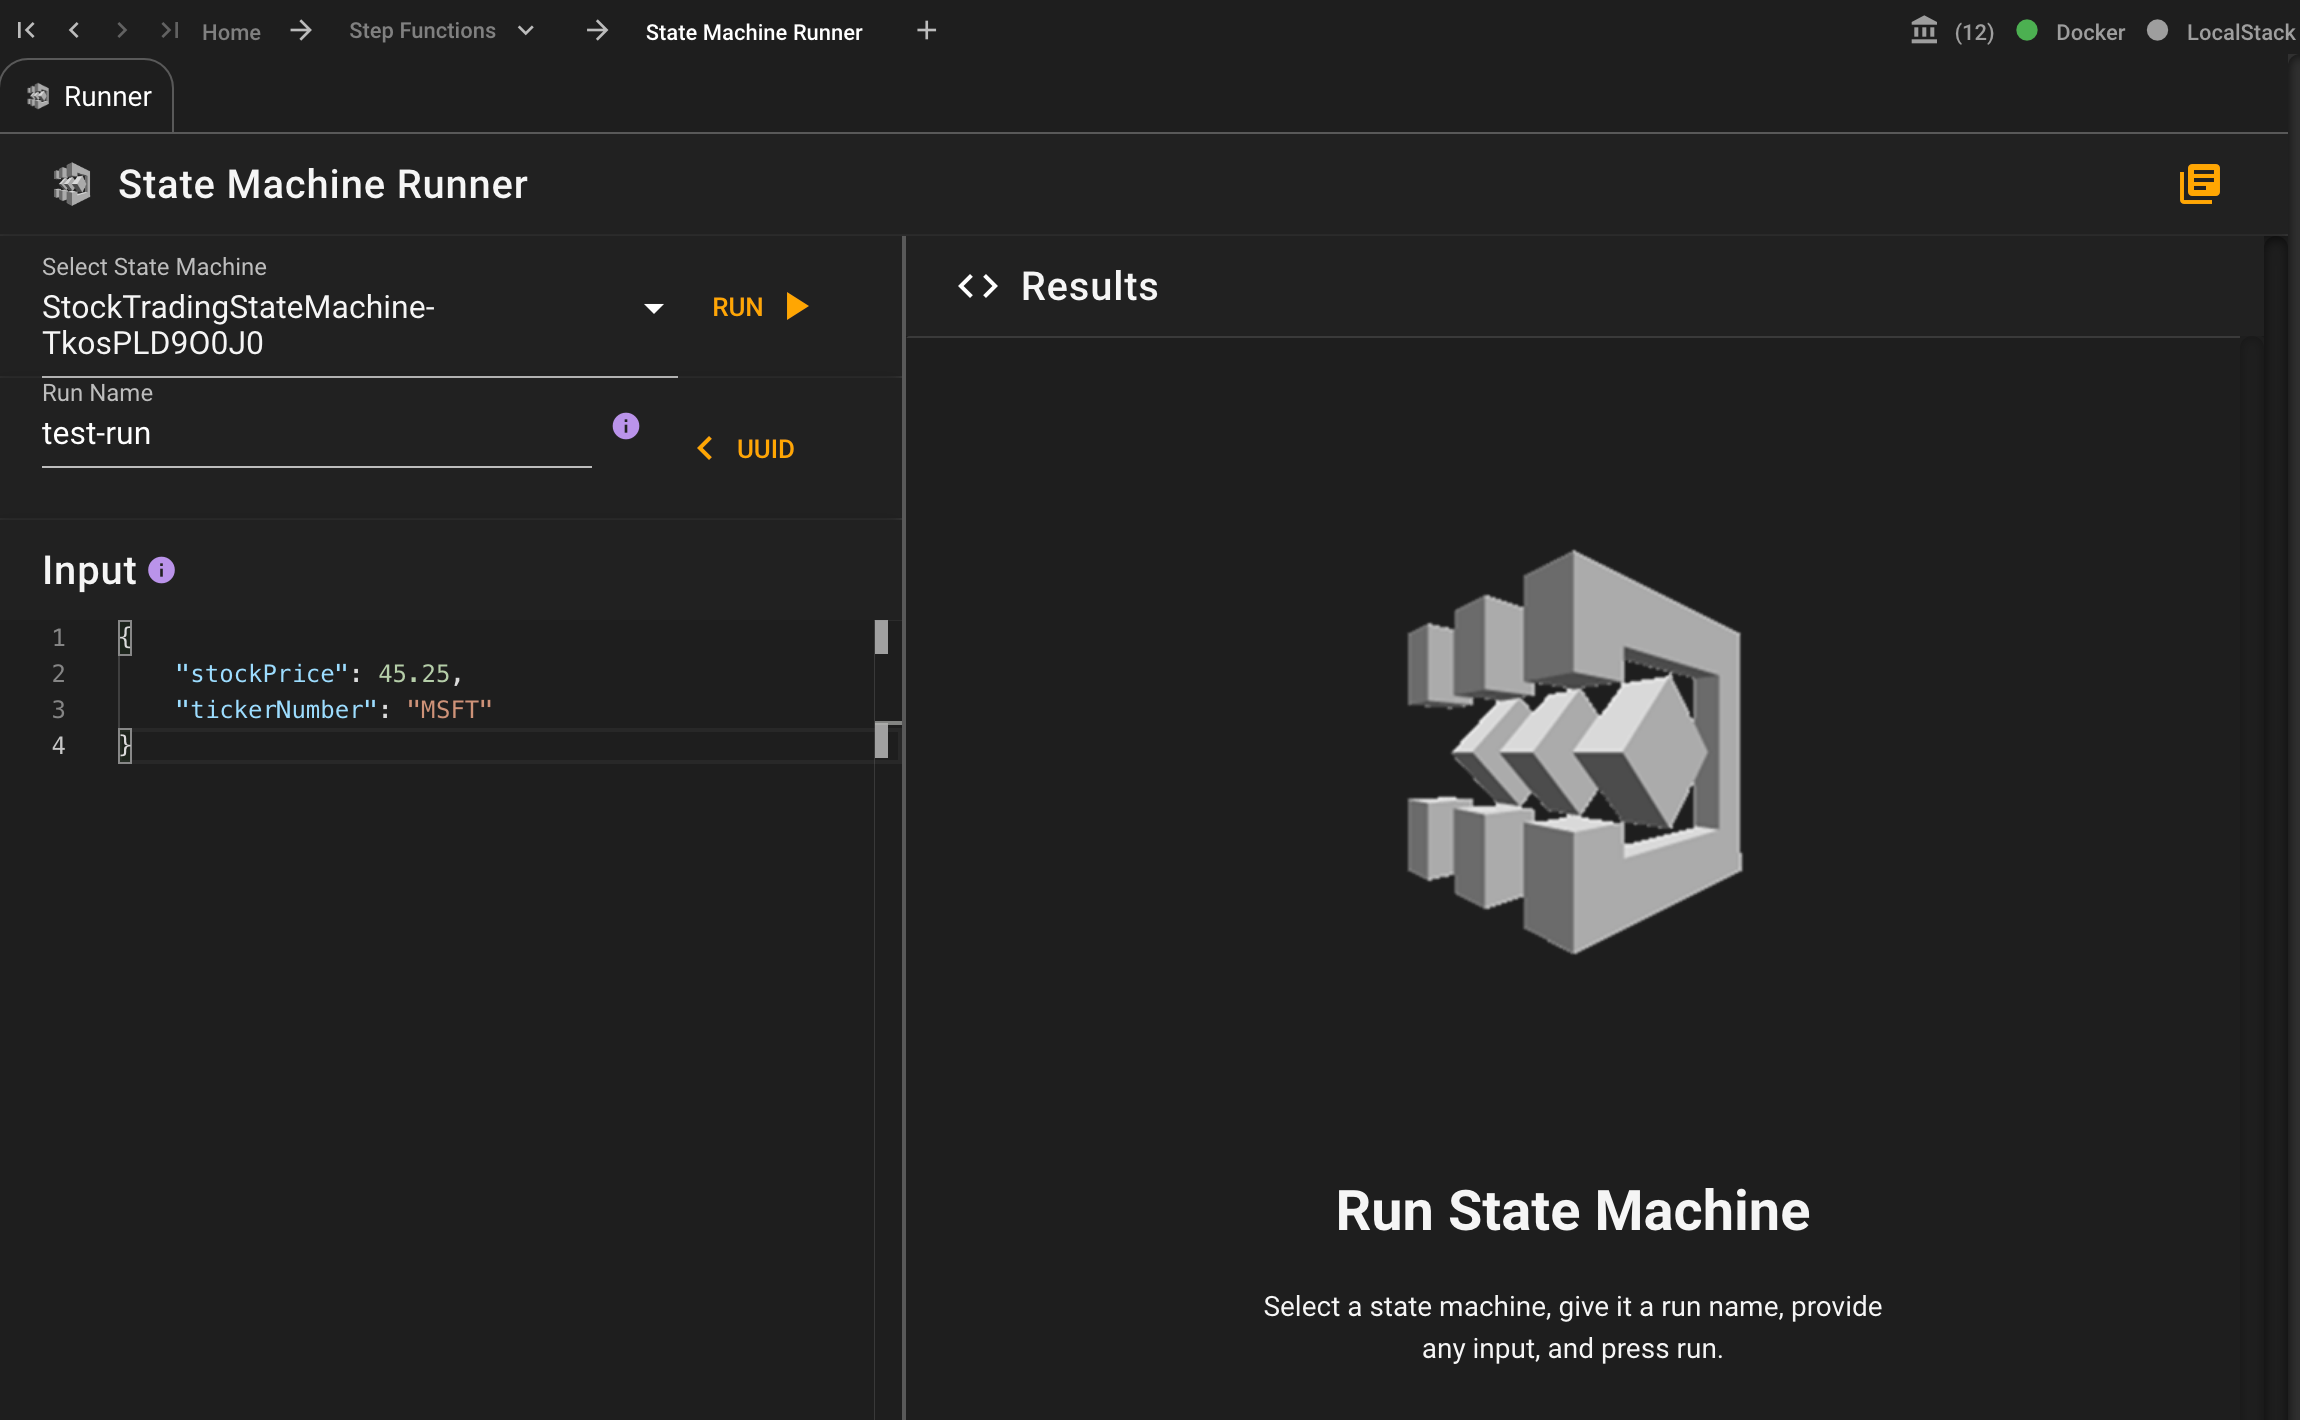
On the left-hand side you can select the State Machine to run, and then assign a unique run name. Then you can add any JSON that you want to pass into the state machine in the input.
Press the run button, and you will see the results.
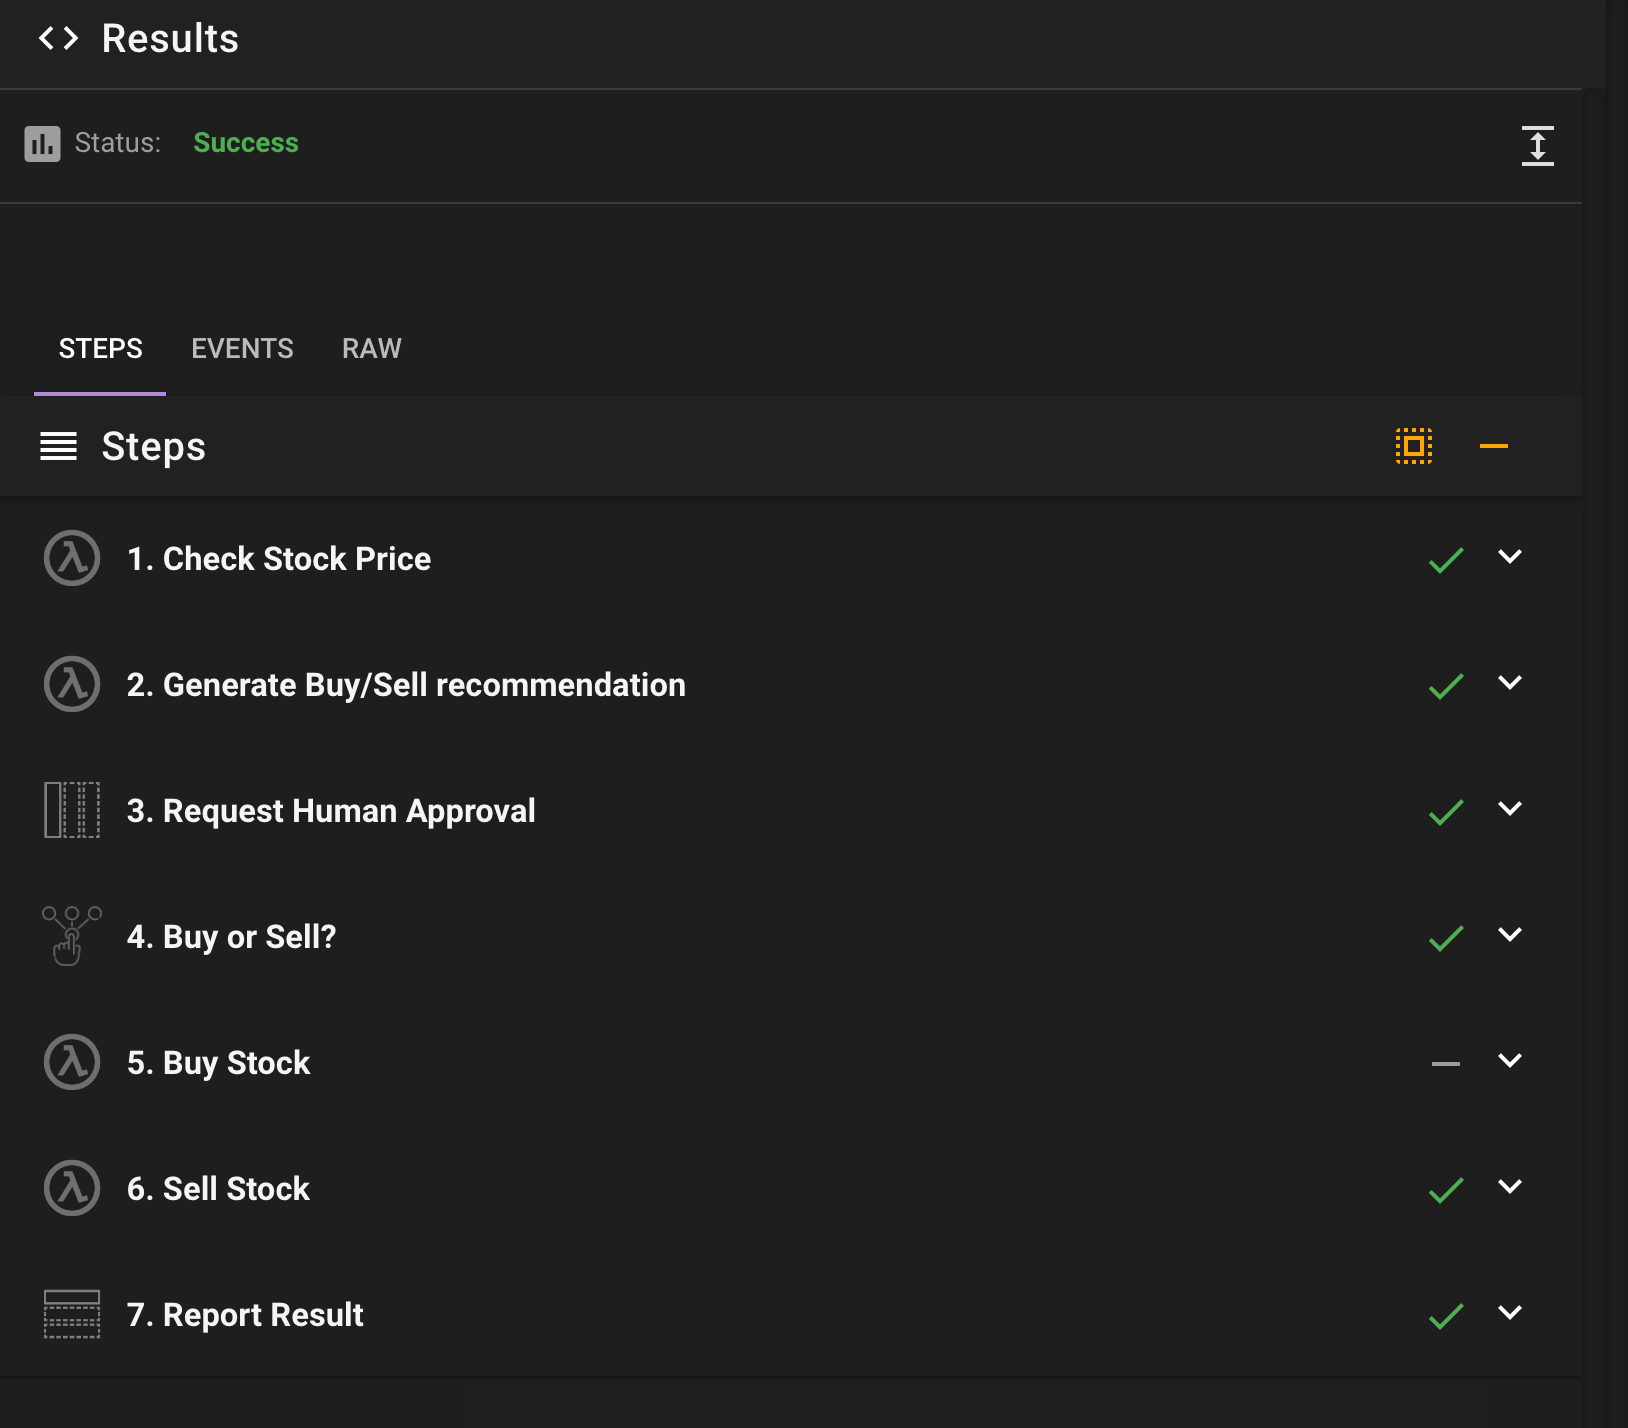
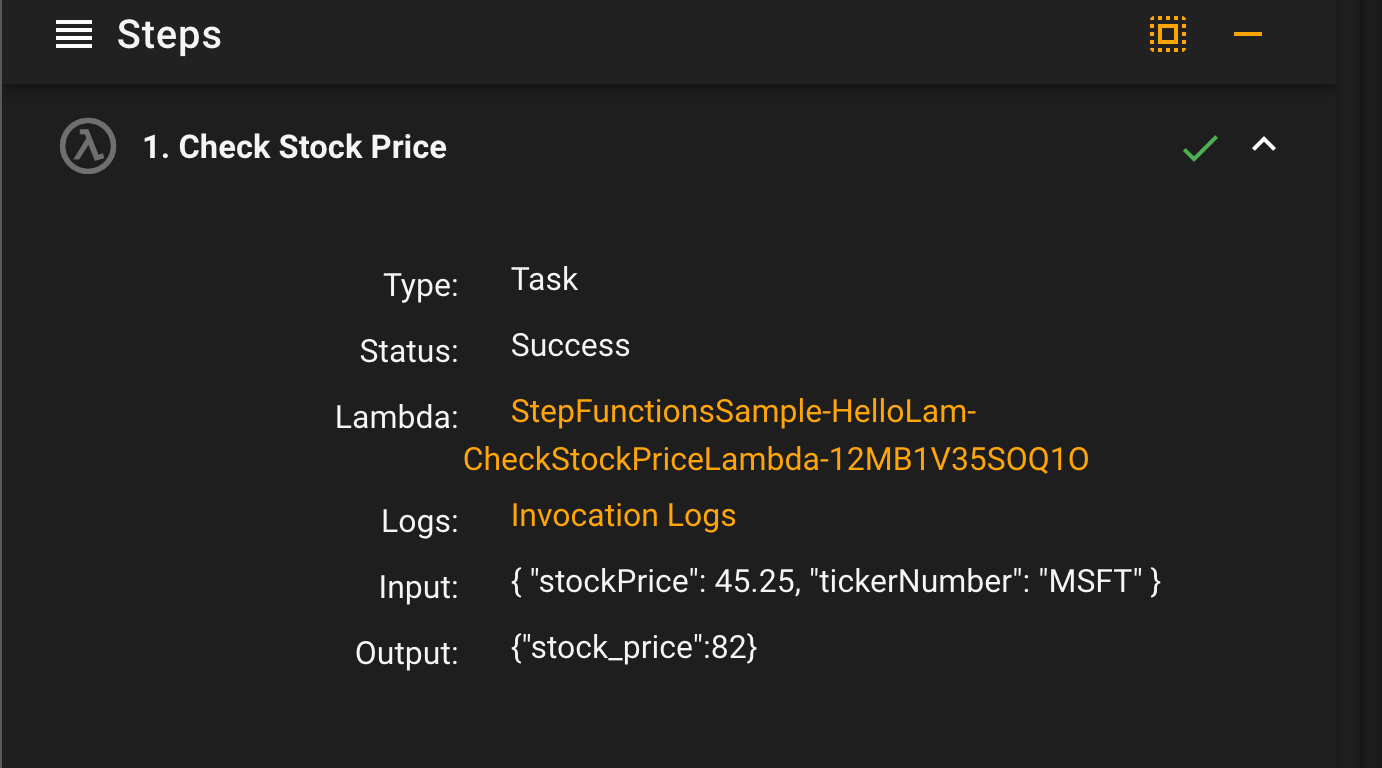
Drilling into an individual step, you can see the Lambda resource that was invoked, and a link to the generated logs.
# Conclusion
Testing your Lambda's is a key component of software development. While unit tests will get you pretty far in ensuring your code works, being able to test out the functionality in not only a visual way, but also using the actual underlying AWS resources is a highly valuable way to ensure your system is working as expected.