Viewing your DynamoDB System Diagram
... About 1 min
# Viewing your DynamoDB System Diagram
DynamoDB is a great NoSQL database. And aside from the basically infinite scalability, and ability to store ever-changing data easier, there are also some really great connections that you can do with Lambda and DynamoDB Streams.
DynamoDB Streams allow a Lambda to be invoked anytime data is created, updated or deleted in DynamoDB. You might want to send an email when a new user record is added, or send a warning to Slack when records are deleted.
In this short tutorial, we will show you the key points of the DynamoDB System Diagram.
# Step 1 - Go to the DynamoDB Side Navigation
On the DynamoDB side navigation, you can see the System Diagram menu item, as below.
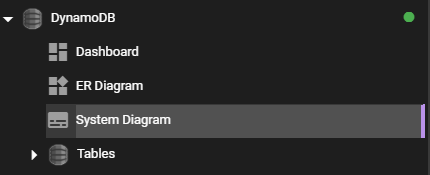
Press the System Diagram menu item and you will be presented with the diagram page shown below.
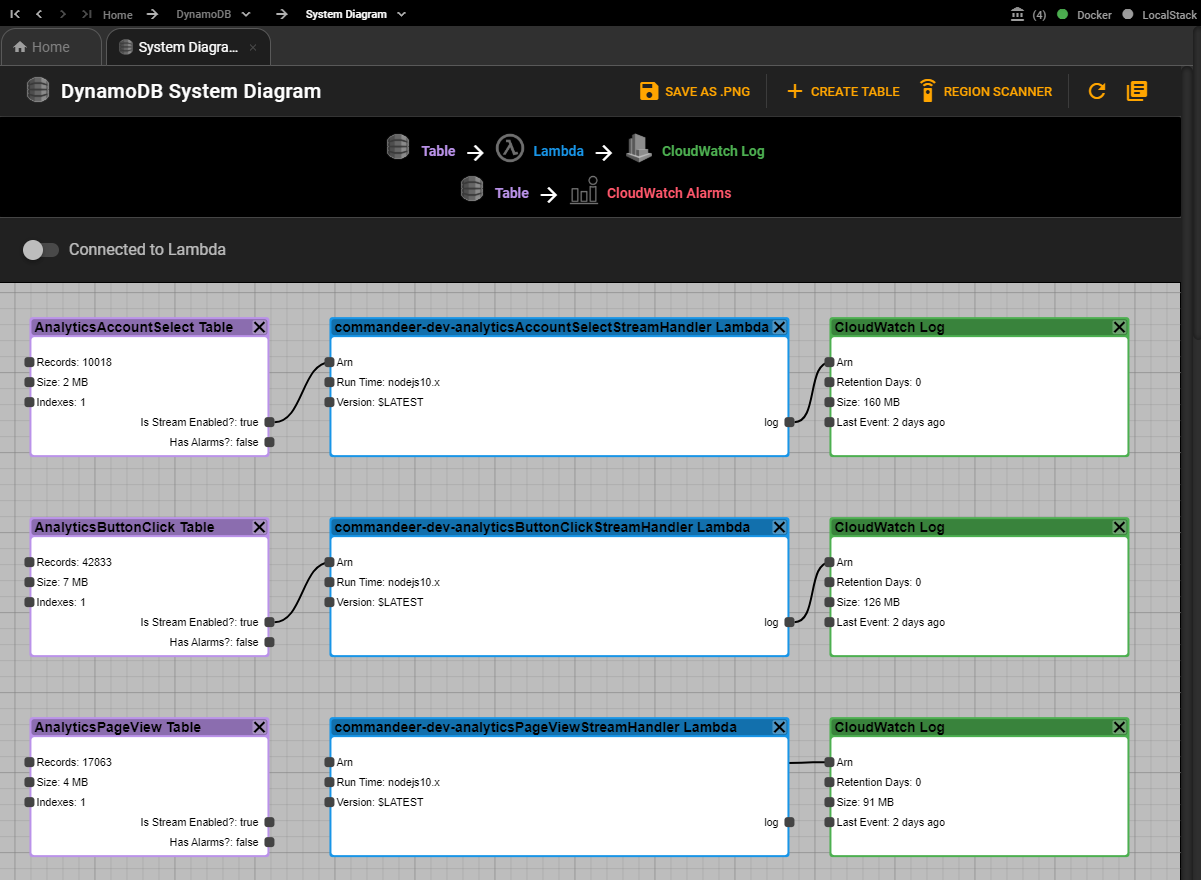
It shows you all your DynamoDB tables, and then if they are connected to a Lambda. Subsequently, if the Lambda is then connected to a CloudWatch Log, you will also see this.
If we zoom in, you can see that there is some basic information about the table. You can also see basic info about the Lambda and the CloudWatch Logs.
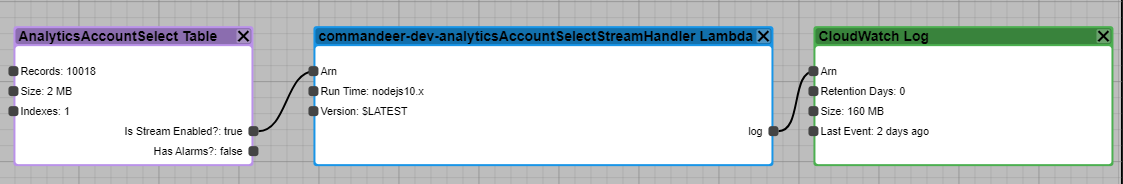
You can also view any CloudWatch Alarms that are connected to a table as well.

# Export to .PNG
Pressing the 'Save as .PNG' will give you a dialog, allowing you to export the diagram to a png, so you can share with your team or other people easily. Simply click the button on the top toolbar of the page.
And you will be shown the native save dialog to save it to your computer.
# Conclusion
Visualizing your system is a very important thing not just for you, but for everyone on your team. By being able to actually see how the system is setup, you can better communicate new enhancements to the system, and most importantly, a developer can actually see the system on something other than a whiteboard.