Top Ways to test a Lambda
# Top Ways to test a Lambda
Lambda's are the code glue in an event-driven serverless system. But, testing them is not as straight forward as other types of programming. In this article, I will layout five different ways to test them. All tests will be using the sample code that can be found here.
# Unit Testing with lambda-tester npm and mocha
Unit tests are a critical piece of any system. Without proper unit tests, your system will become more frail over time. This is especially true as you start to ramp up a team and bring on more developers. Unit tests gives you peace of mind that your code is working as intended. You can find out more about lambda-tester on their npm page. And mocha unit testing on their site.
To get started:
# clone the repo

# go to robinhood-for-reddit app
cd sample-apps/robinhood-for-reddit

# install the dependencies
yarn install

# run the tests
yarn test
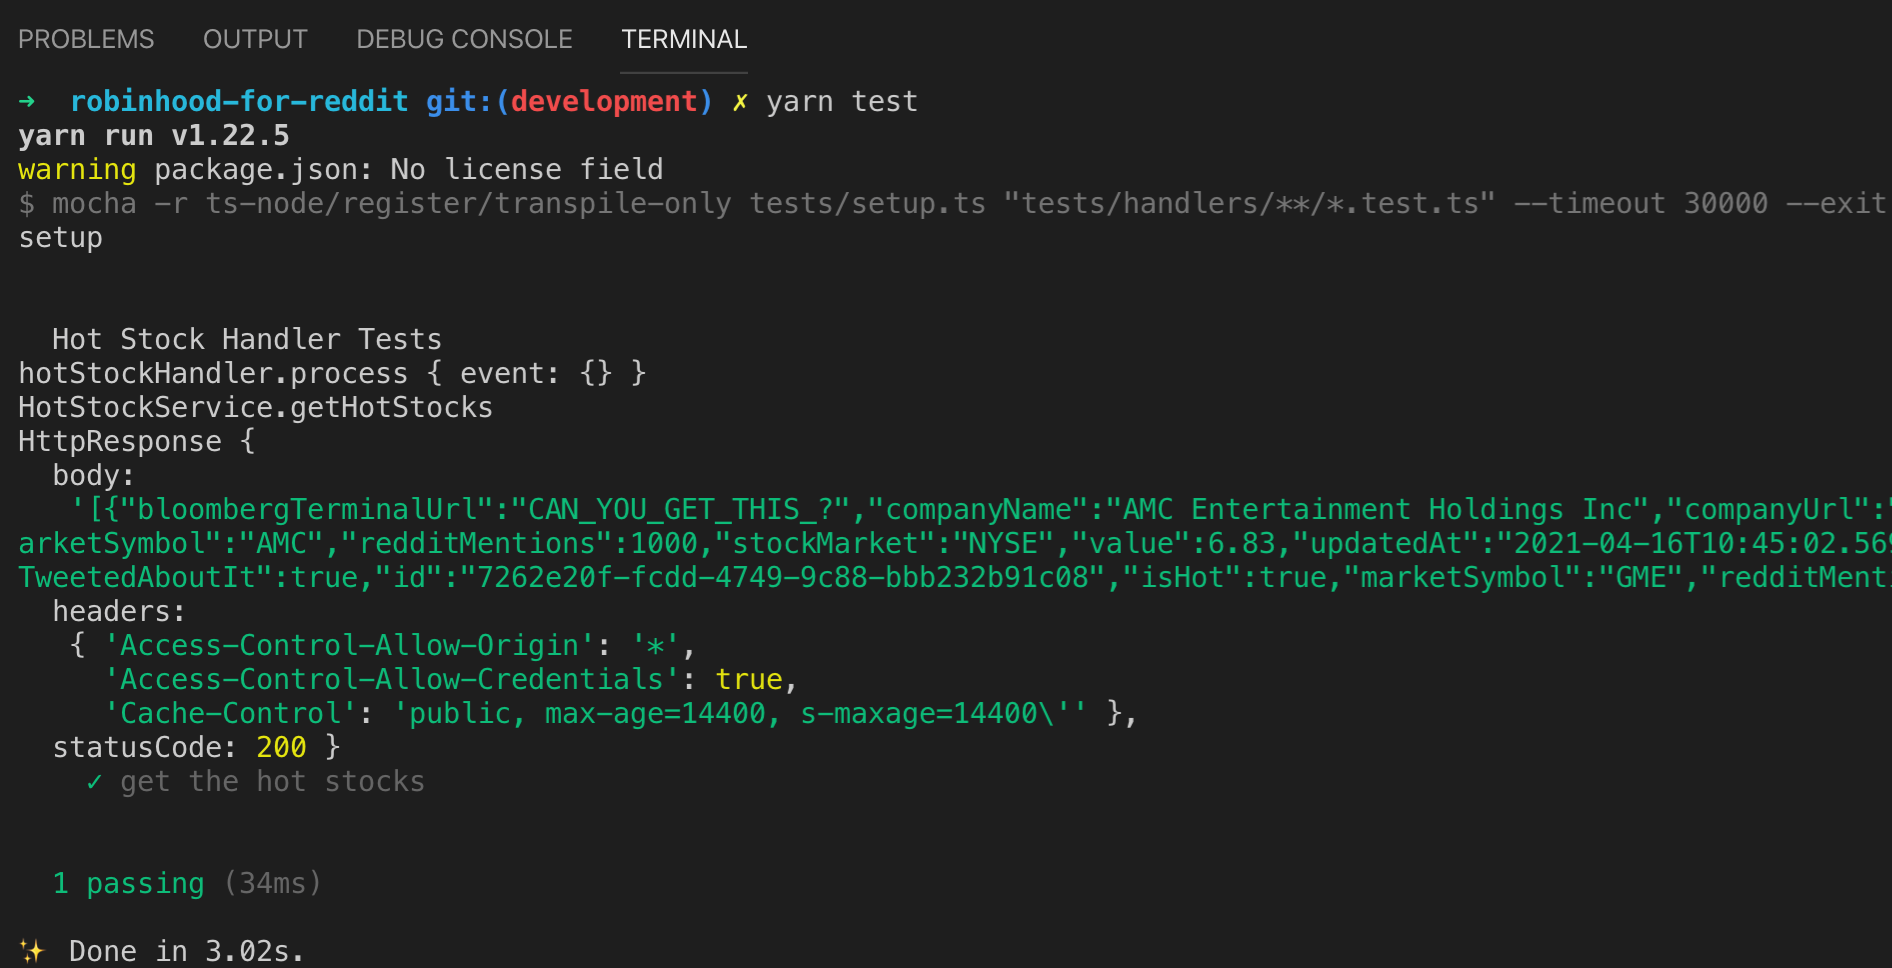
Once you run this, you can see the output from the code below. Not only is this a great way to quickly test, as you can add in console.log statements, or step through the code in your IDE, but these tests can also be run on Circle.ci or some other CI/CD system.
# Pros
- run from the terminal
- can be put onto CI
- very fast feedback loop
# Cons
- only tests against local (though you can setup your environment to have your local lambda's hit external data sources)
- does not give you total visibility into the system
# Testing with Postman and viewing the CloudWatch Logs in AWS Console, Dashbird.io, or Commandeer
Postman is a great tool for testing API's for a number of reasons. First of all, it has an amazing UI that enables you to quickly and easily create tests to call an endpoint, and save the header and body. It also has multiple environments, so you can hit local, dev, or prod easily. Lastly, the collections that you create can be downloaded as json files, and then using their newman npm, you can run these locally or on CI/CD.
The downside is that you will only see the returned status, body, and header for the calls. But for frontend devs, this is usually enough. Below you can see a sample call to the great-deals endpoint we have setup in this repo.
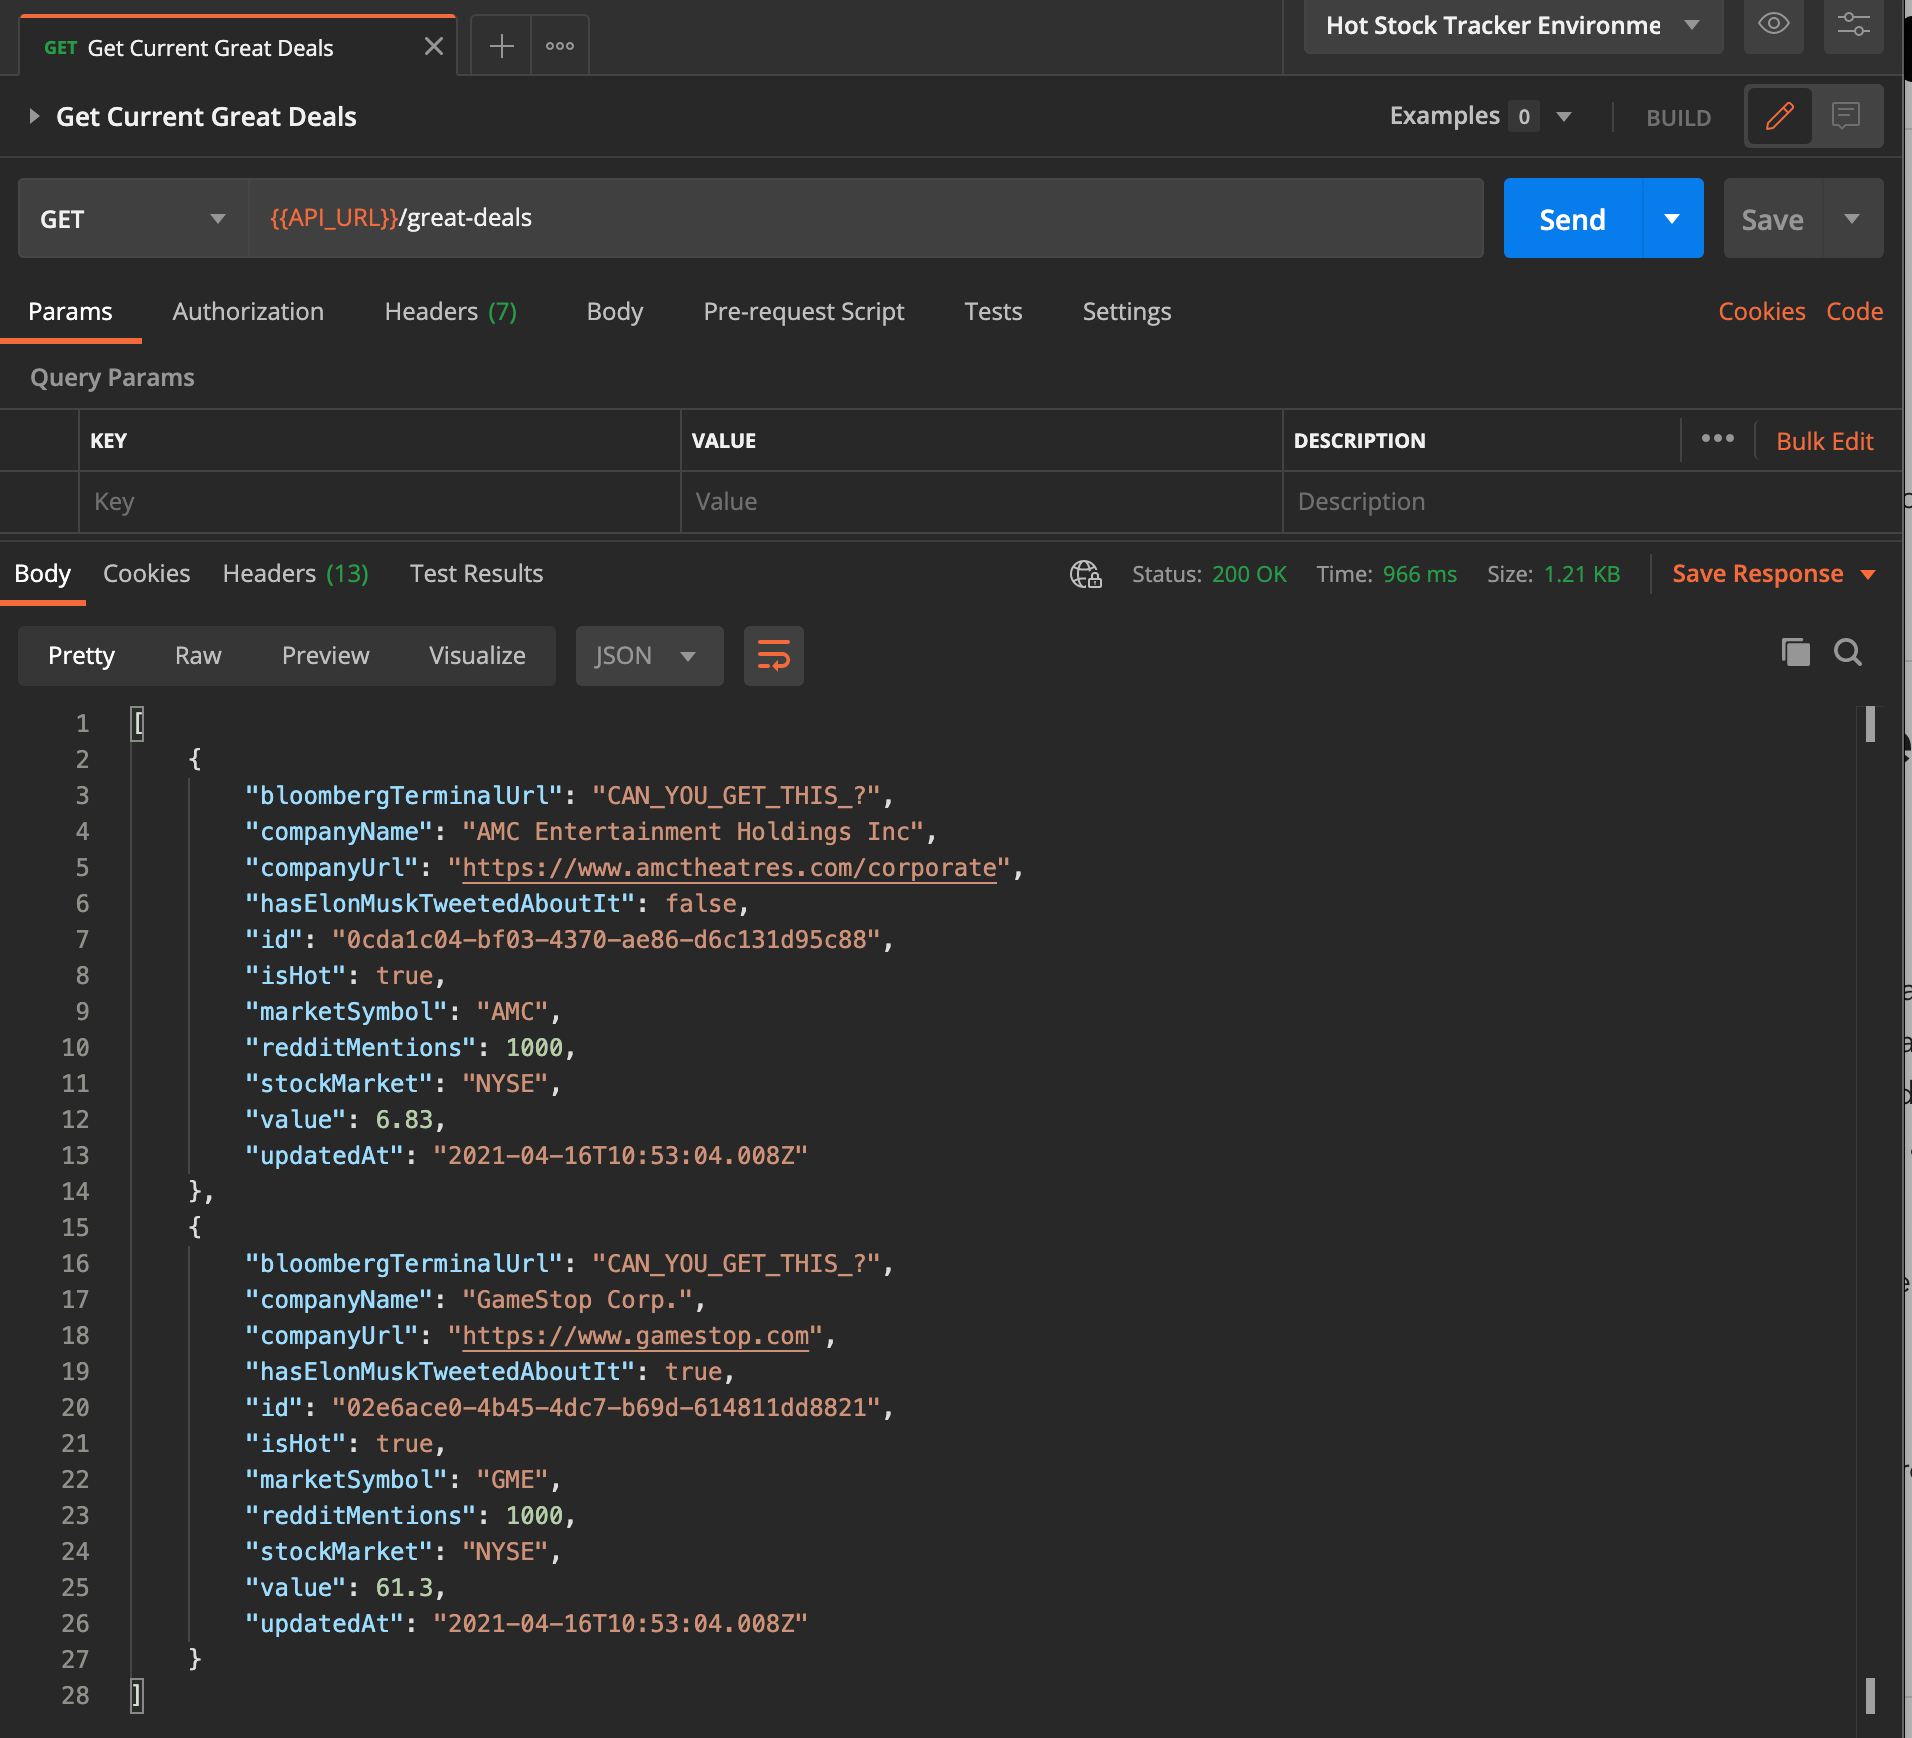
We can see that there is a 200 OK status as well as the two items in the array passed back.
But, if you need to see the logs, we will have to use another tool.
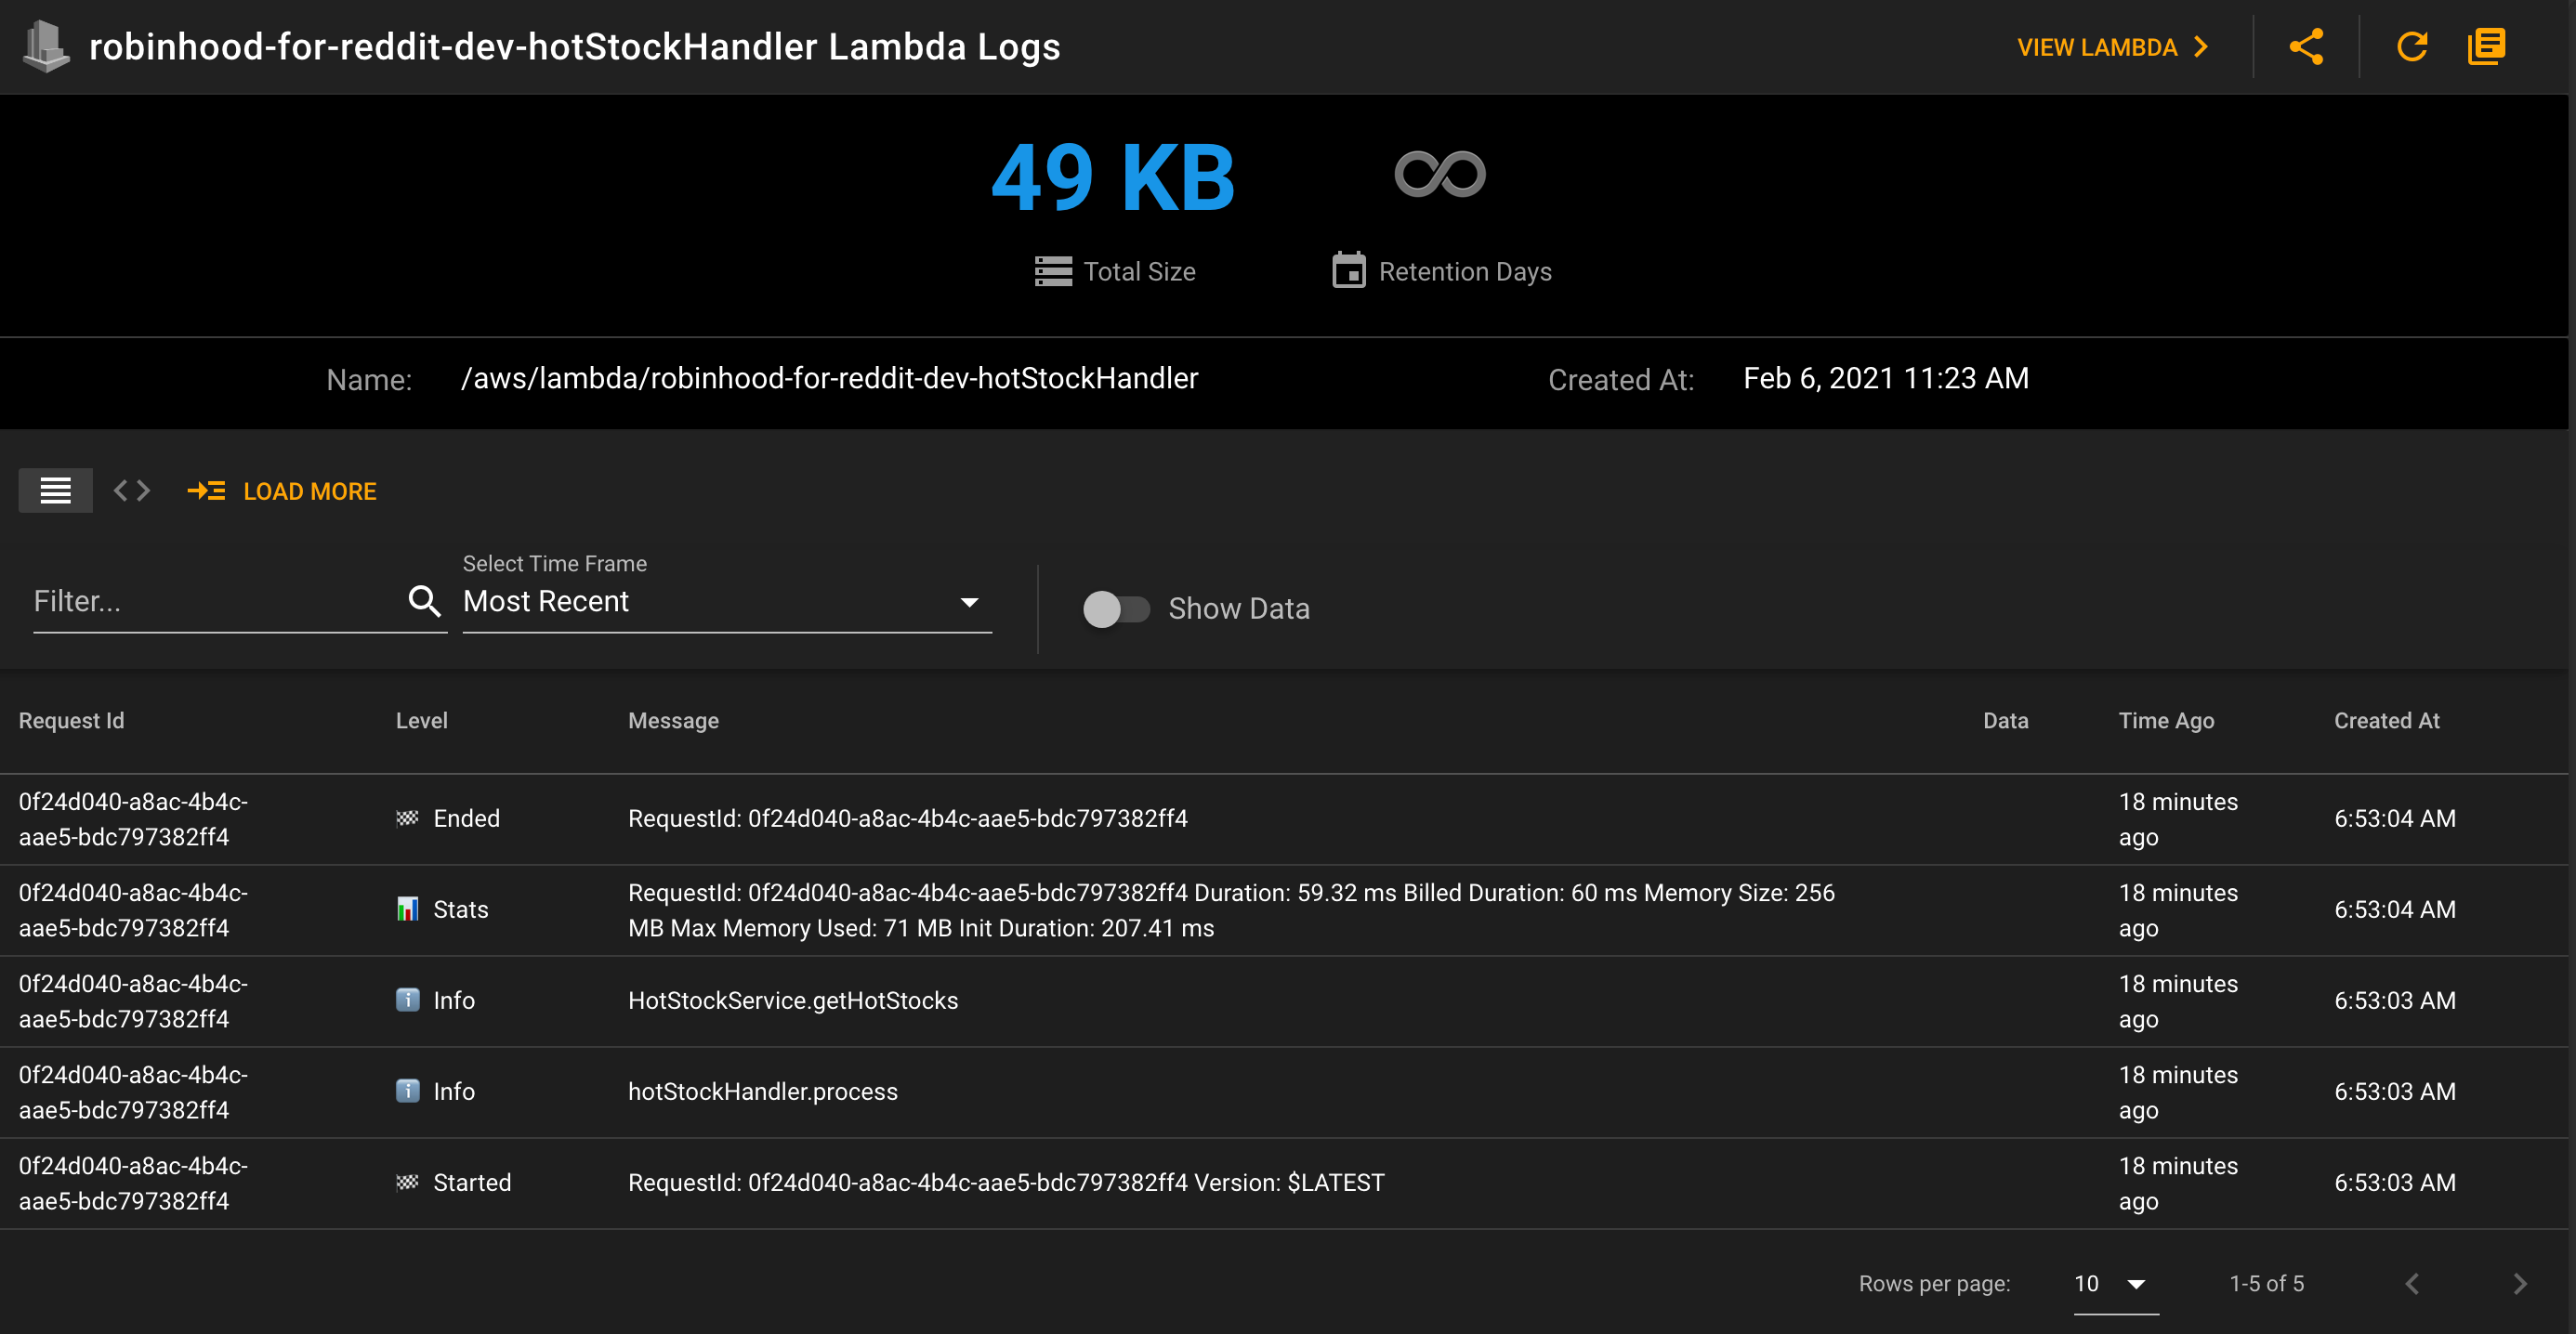
First, we can see them in CloudWatch Logs directly on AWS console. The downside of this, is that the UI is rather clunky, as you have to know the Log Group, and then you have to open the correct 15 minute stream. But, when you do, you will see the logs like this.

Viewing it in Dashbird.io is much easier. As they group it logically by invocation for a given Lambda. I highly recommend setting up Dashbird.io on your production environment as well, because the alerting and observability is the best. They also have the ability to manage your alarms and sift through errors easily. Think of it as a NewRelic, or SumoLogic, or DataDog but built from the ground up specifically for Lambda's and serverless systems.
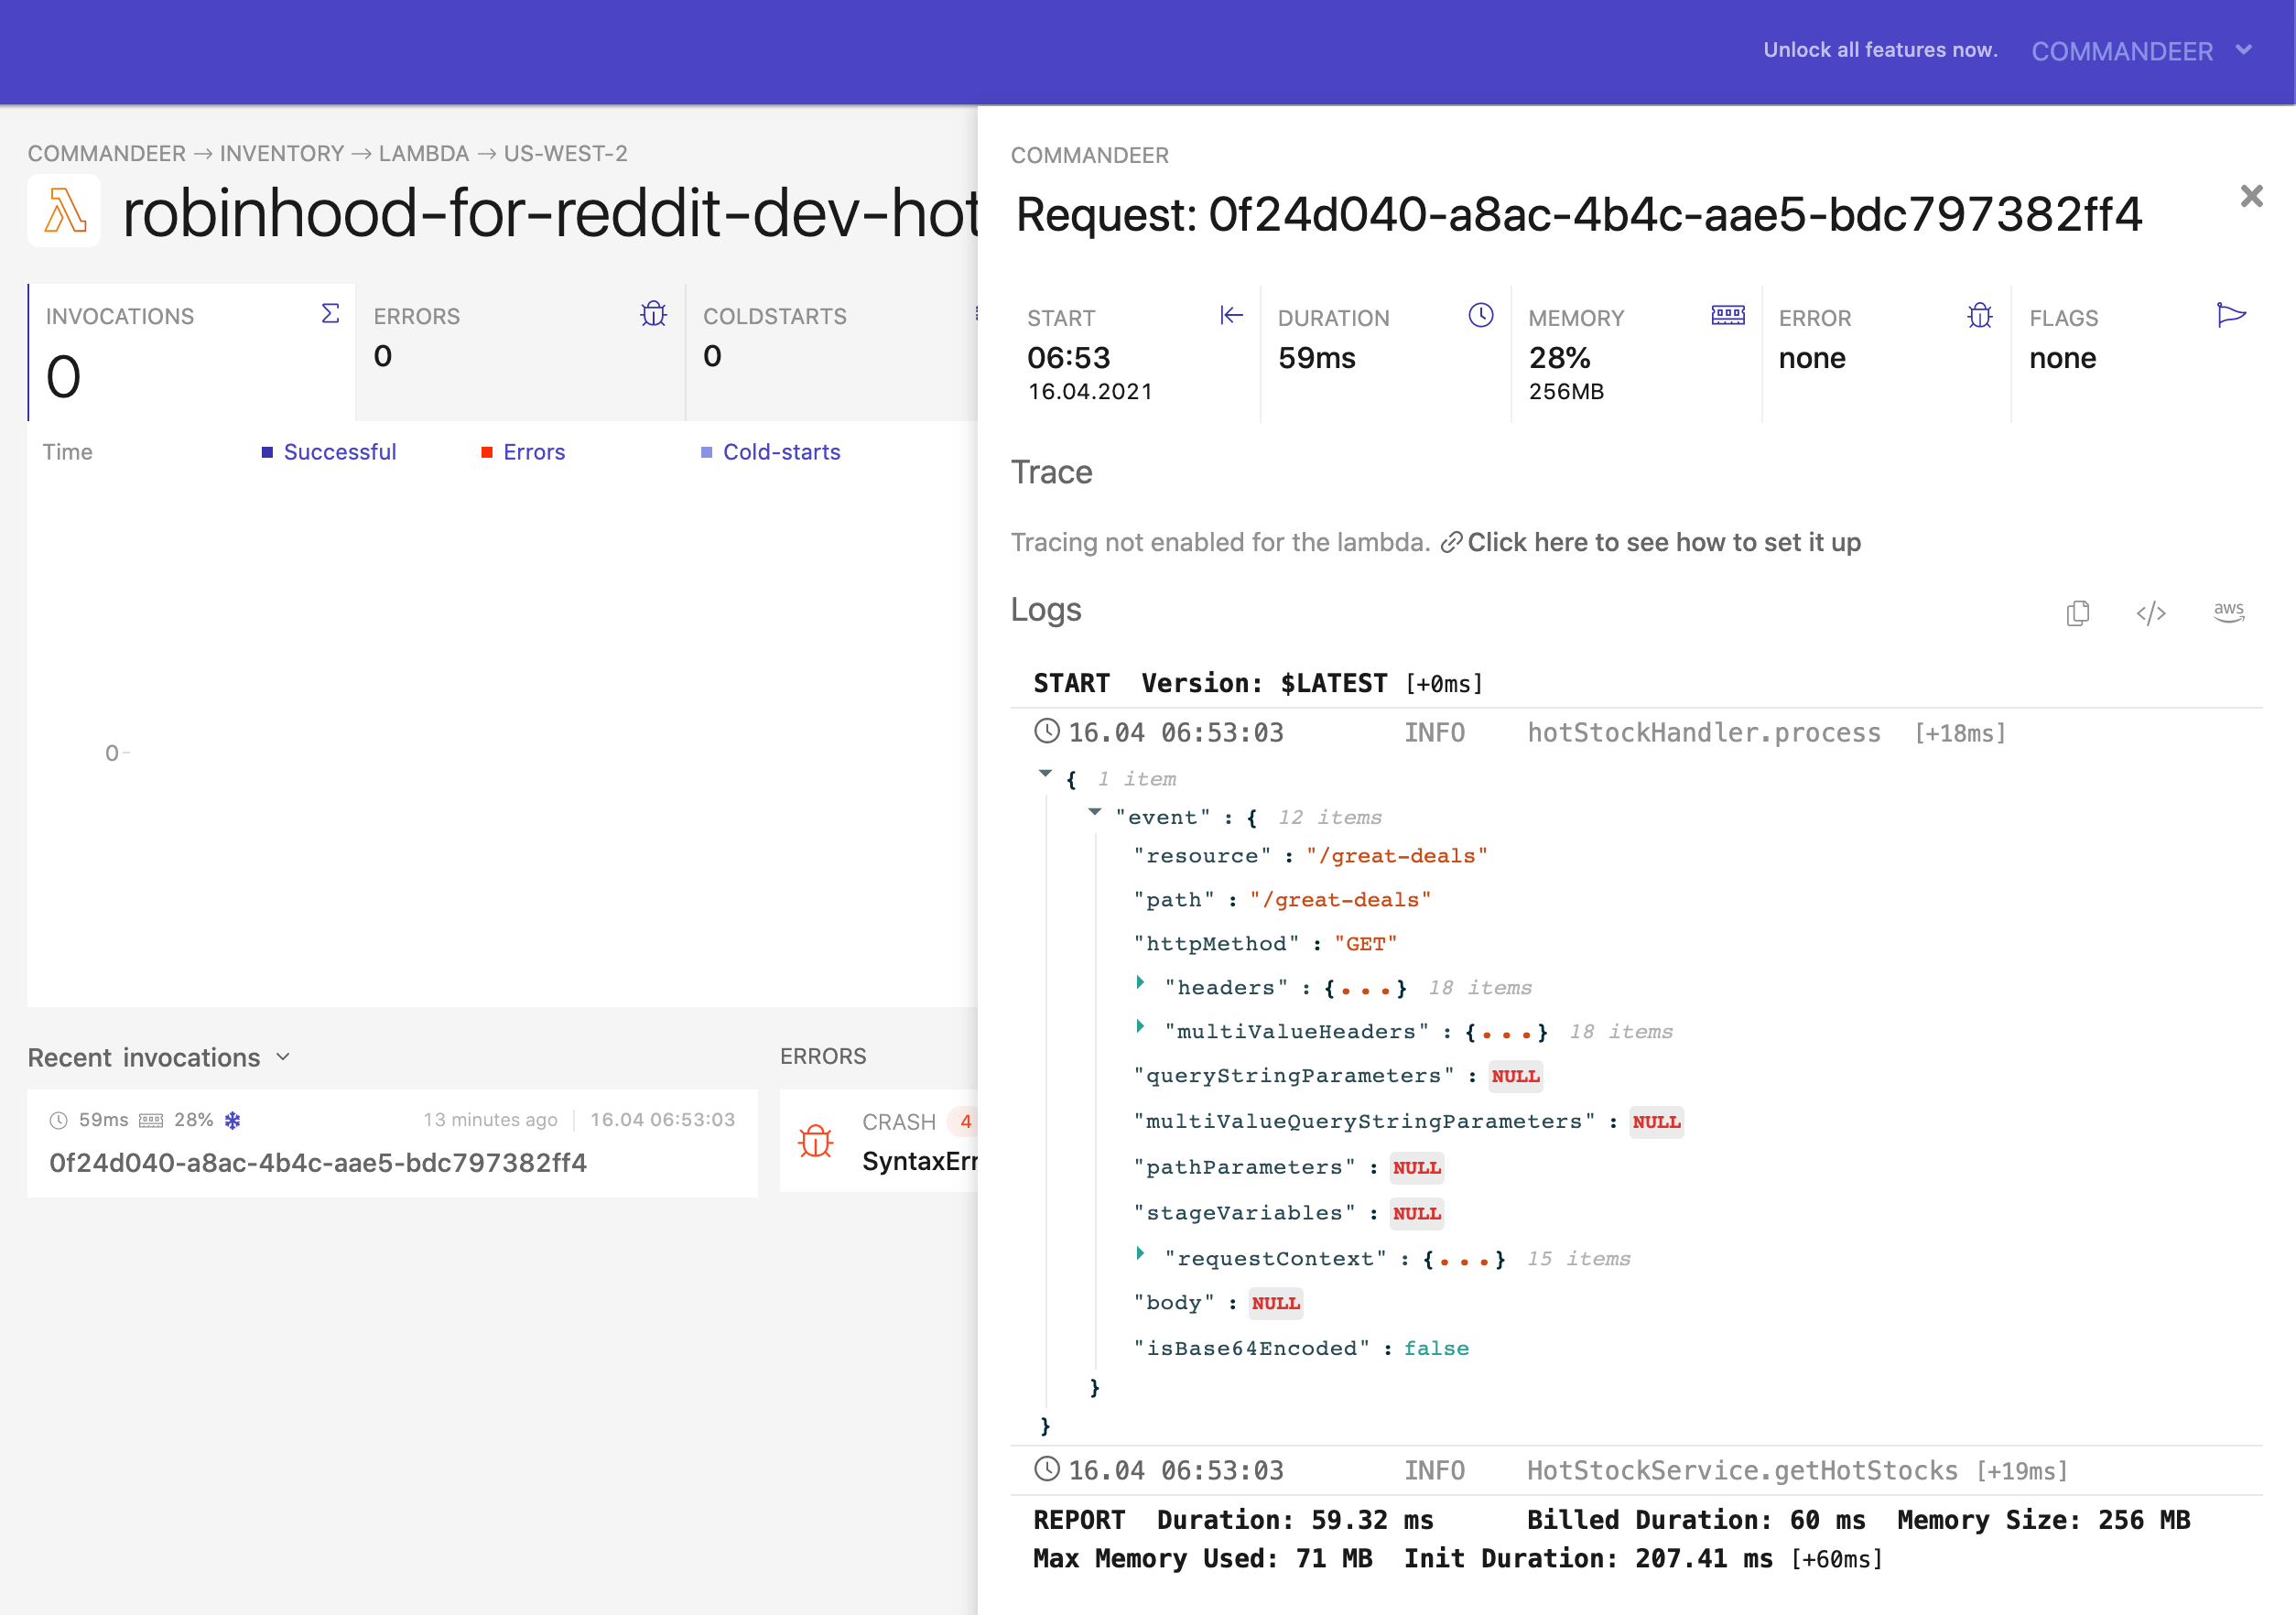
A third alternative is to view the logs for the invoked Lambda in Commandeer. The advantage of this is that it is an app running natively on your computer. In the next section we will dive into it a bit more, but below you can see the logs.
# Pros
- Postman is a highly valuable tool that everyone on the team can find helpful.
- Dashbird.io enables you to not only view your logs, but on production systems, you can also analyze your usage, detect errors, and setup alarms.
- Postman can be added to a CI/CD pipeline with the Newman npm
# Cons
- this setup only works if your Lambda is connected to the API Gateway or AppSync
- you have to use multiple tools to see the whole picture
# Testing with Commandeer
Commandeer has a suite of tools to test out a Lambda. It has testers for testing S3 to Lambda, DynamoDB Streams to Lambda, SNS to Lambda, SQS to Lambda, and API Gateway to Lambda. While we are developing systems, we use Commandeer to do much of the heavy lifting in being able to view the system and quickly test out our Lambdas.
Download the Commandeer App - 15-day Free Trial - The #1 developer IDE to manage your serverless and container infrastructures, both locally and in the cloud. With support for 30+ of the best cloud services out there.
Below you can see running the API Gateway tester.
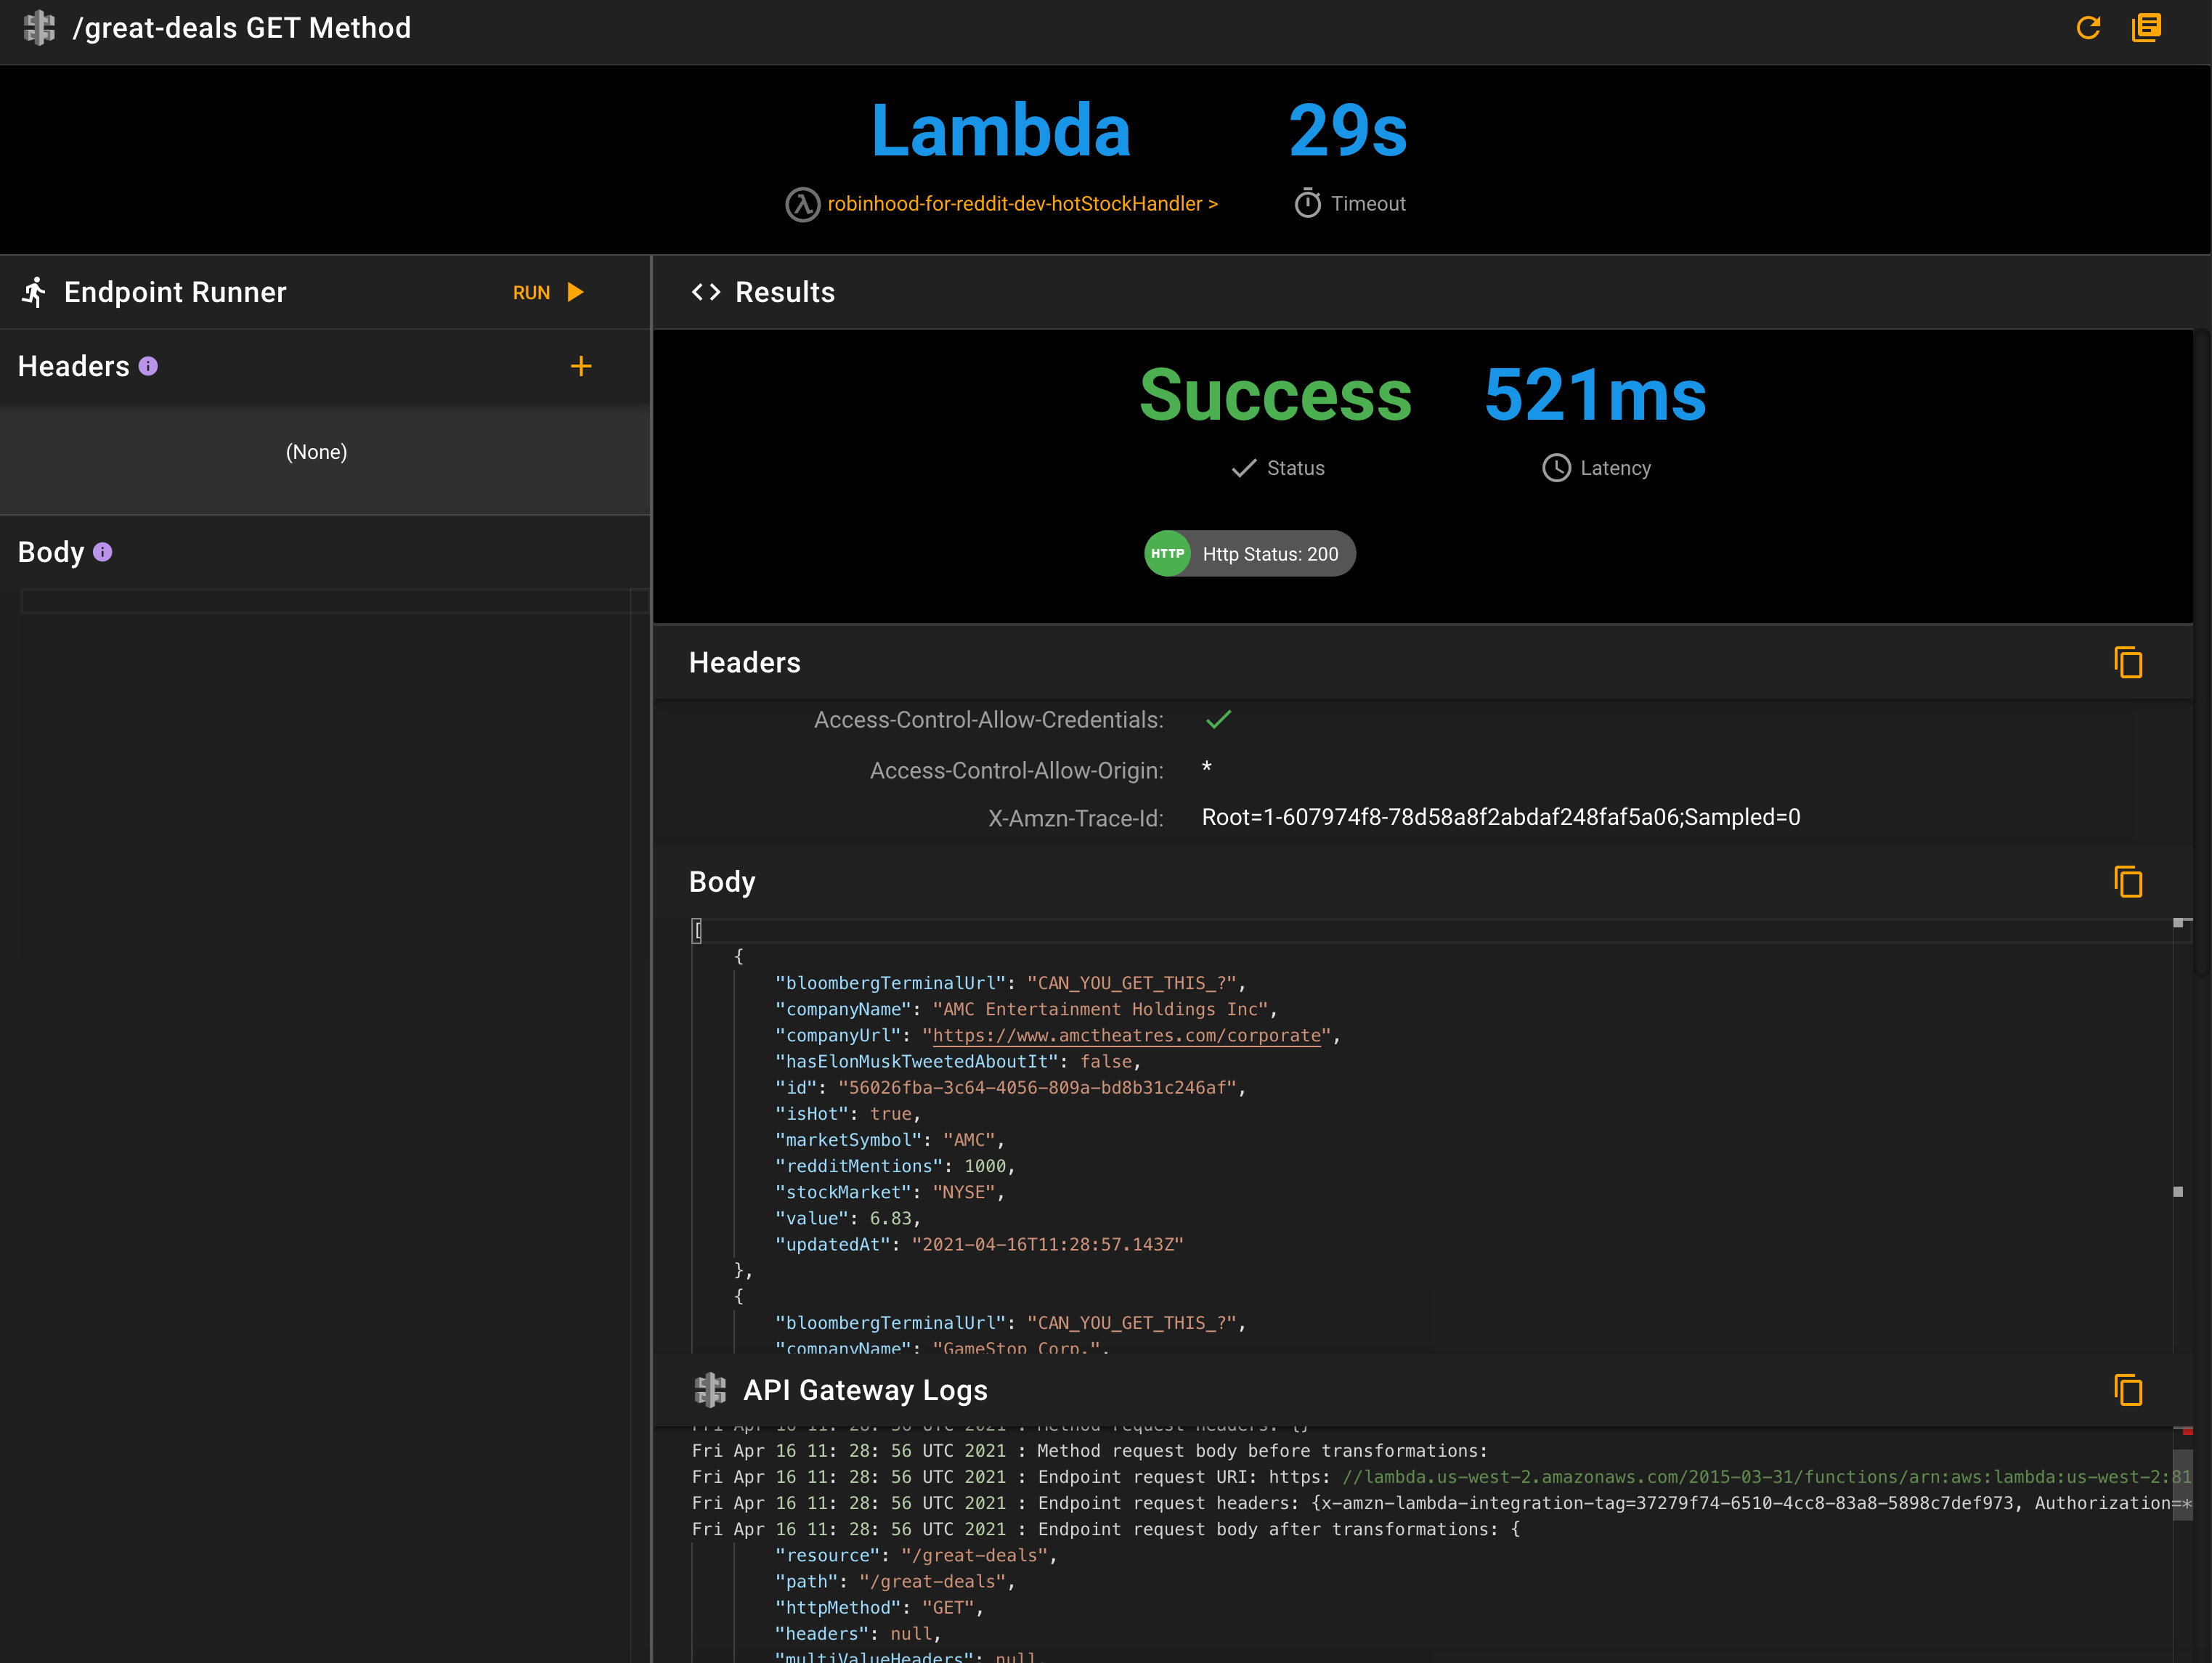
 The really nice part about this is that you not only get the status, header, and body back. But you also get the API Gateway Logs AND the Lambda's CloudWatch Logs information all back in one place. Also, if you are connected to LocalStack in Commandeer, then you will see any logs that are spit out from the Docker container running LocalStack here. So this solution really lets you see everything. The only downside is this is not actually calling your cname'd endpoint, does not run through your authorizer.
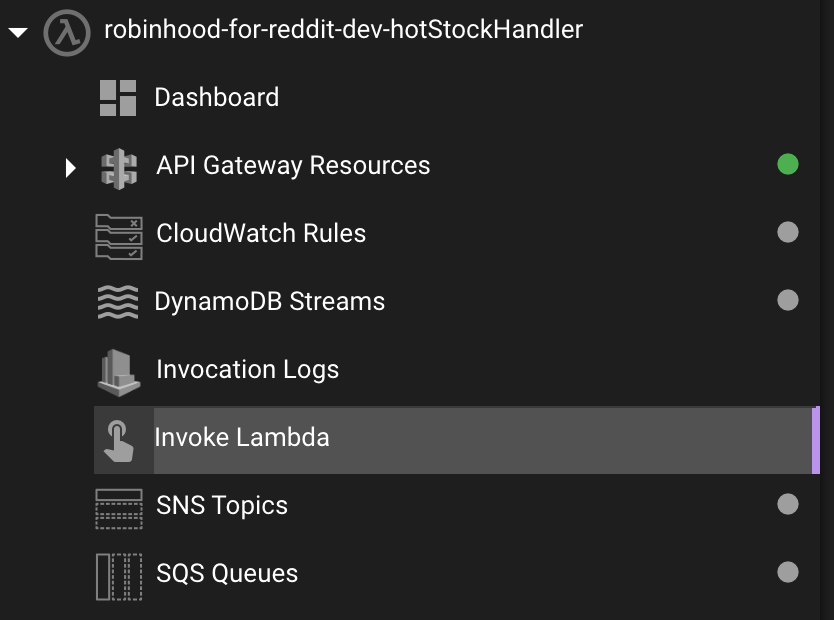
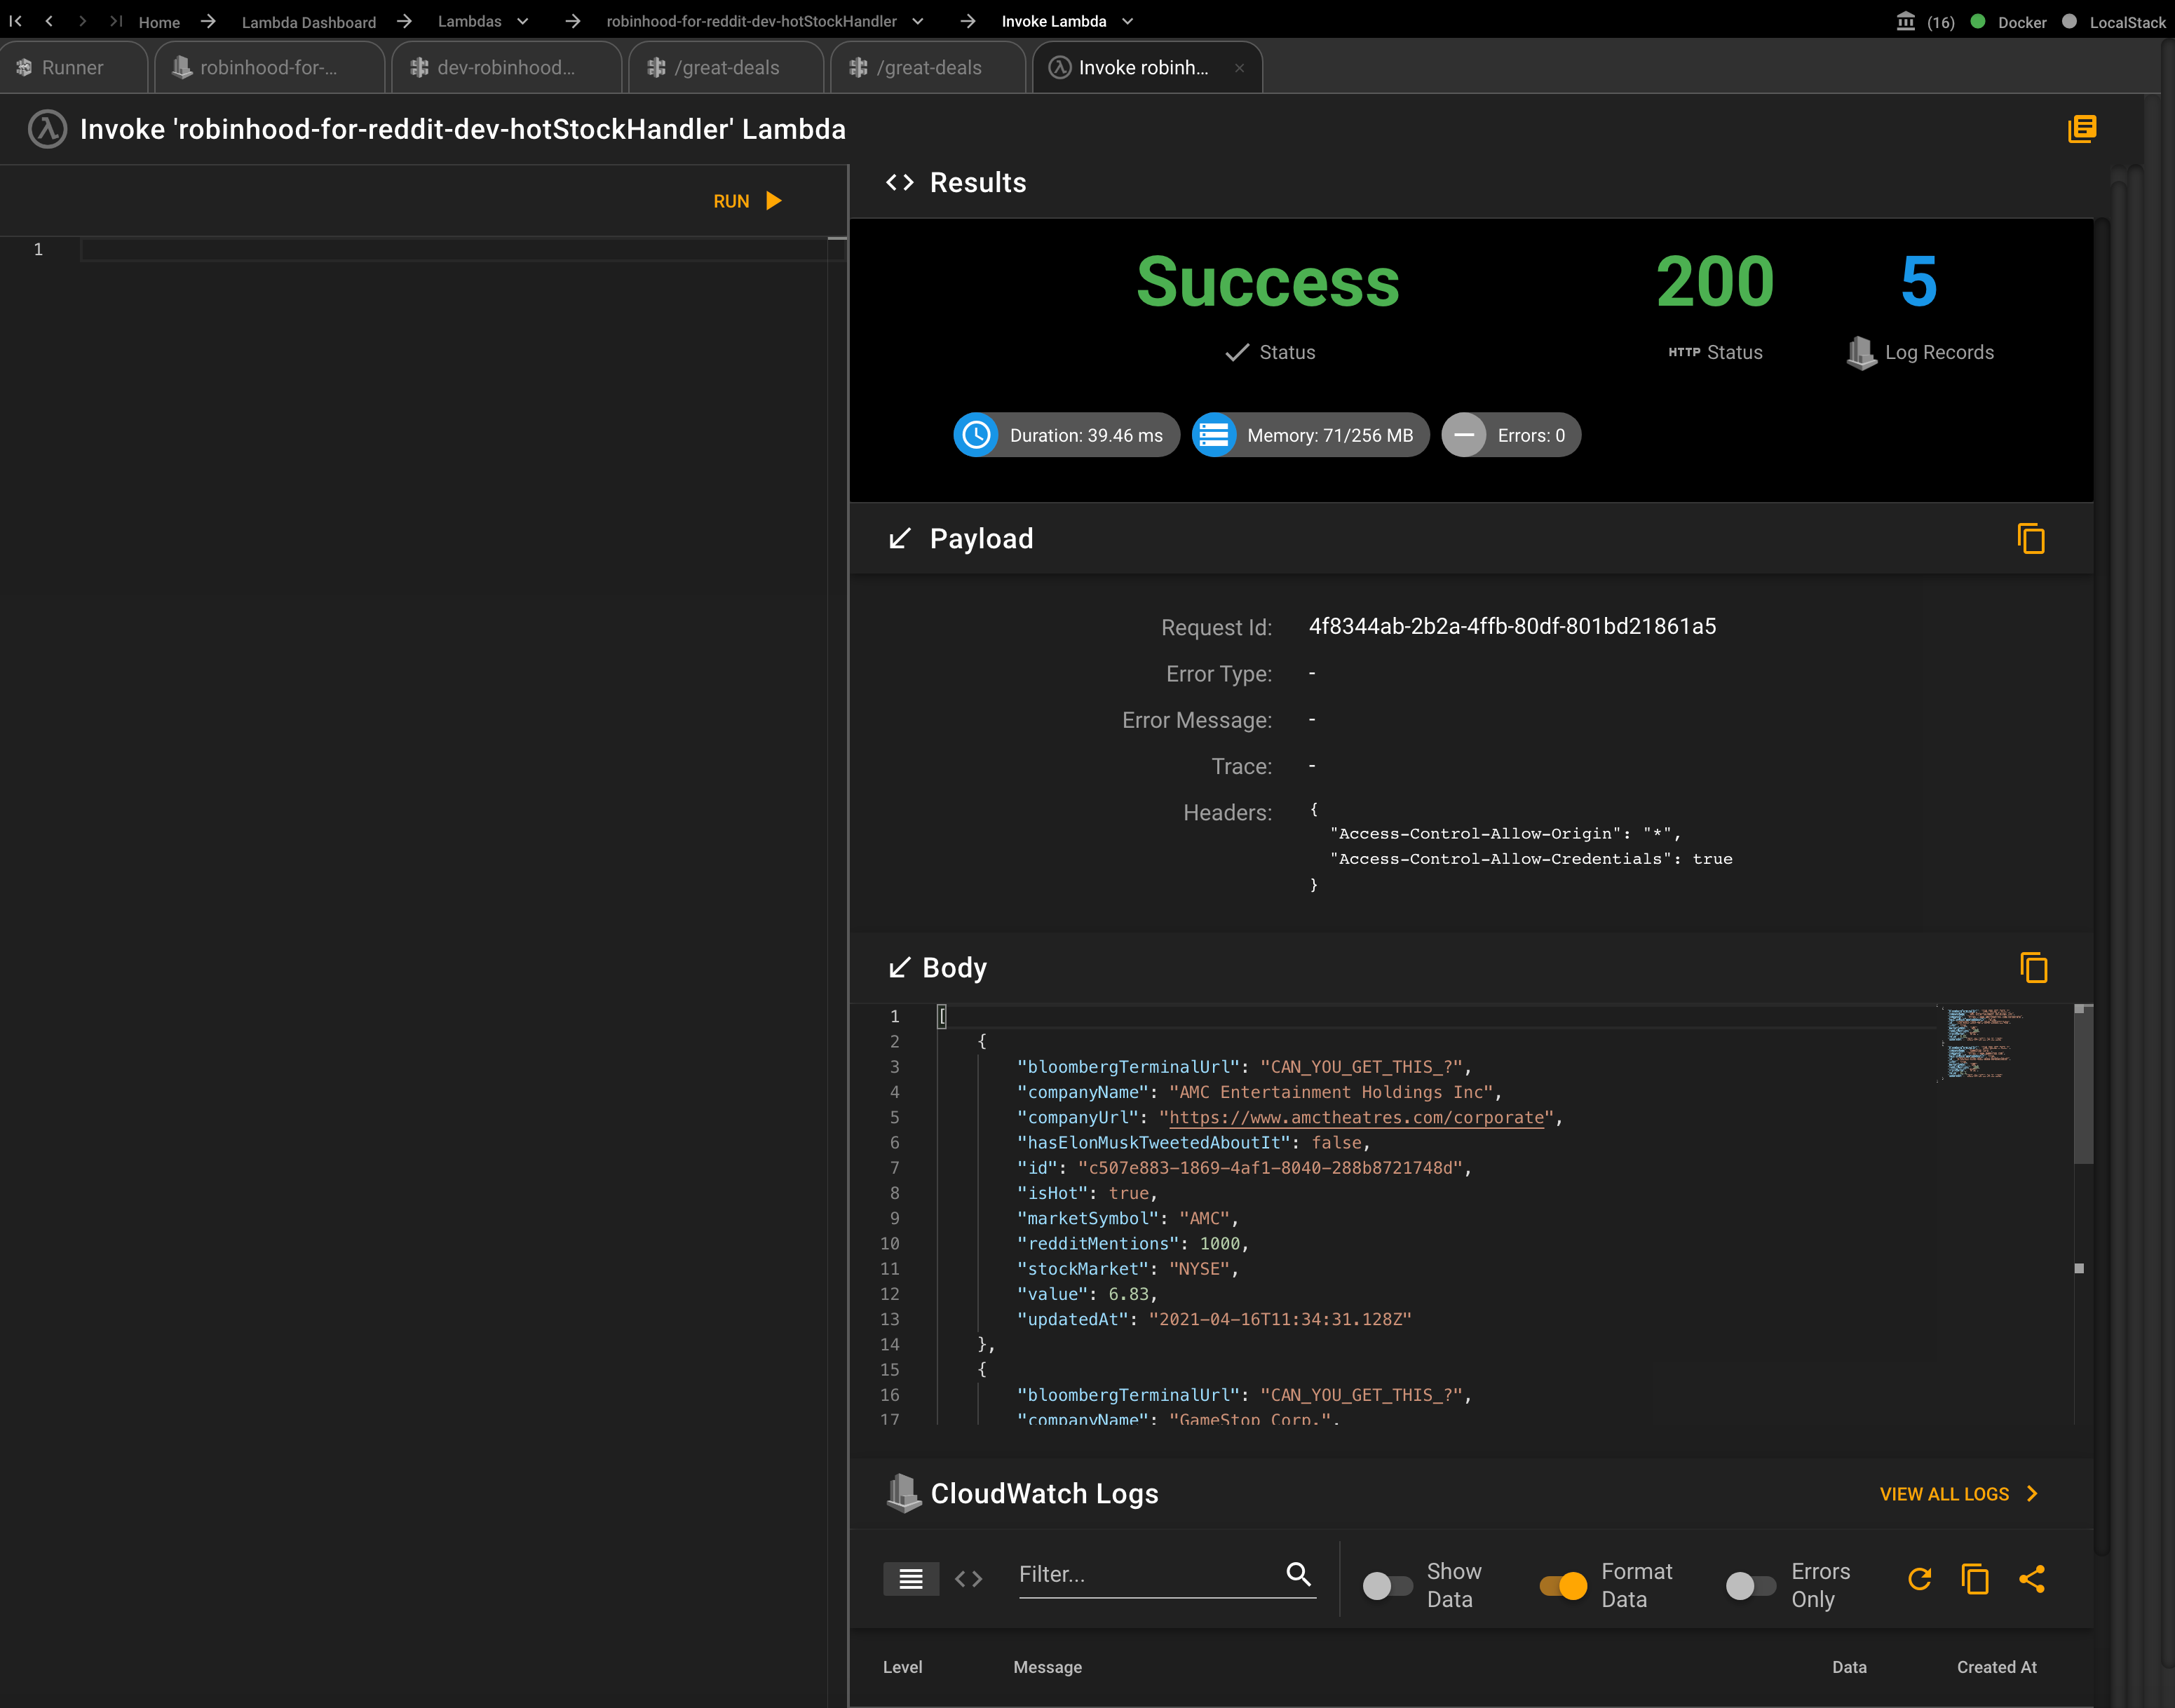
To test the Lambda directly.you can just go to the invoke lambda menu item in the side nav. Another advantage of using Commandeer, is that your entire system is connected to each other in the side navigation. So here you can see the information about your lambda.
When you ito the the Invoke Lambda you can just press the run button. You will see that you get back the payload and body, but also can view the logs right there.
# Pros
- Everything is self-contained, you don't need multiple apps or websites
- You can test out the flow either at the Lambda level directly or from the API Gateway
- If you have other ways you are connected to Lambda, like S3, DynamoDB Streams, SNS, or SQS, you can test those as well
- You get right-click menus and a top menu like a full fledged app
# Cons
- this setup is not ideal for a production environment as we don't recommend having prod keys, or connecting to prod very often
- does not integrate with CI/CD
- API Gateway doesn't call the actual cname'd url and doesn't run through your authorizer lambda.
# Testing in the AWS Console
The AWS Console is a great backup in a punch. Testing in the AWS Console can be done in two ways for this particular lambda. Since it is setup in the API Gateway, we can test it via the API Gateway testing tool. Below you can see invoking it from the API Gateway page.
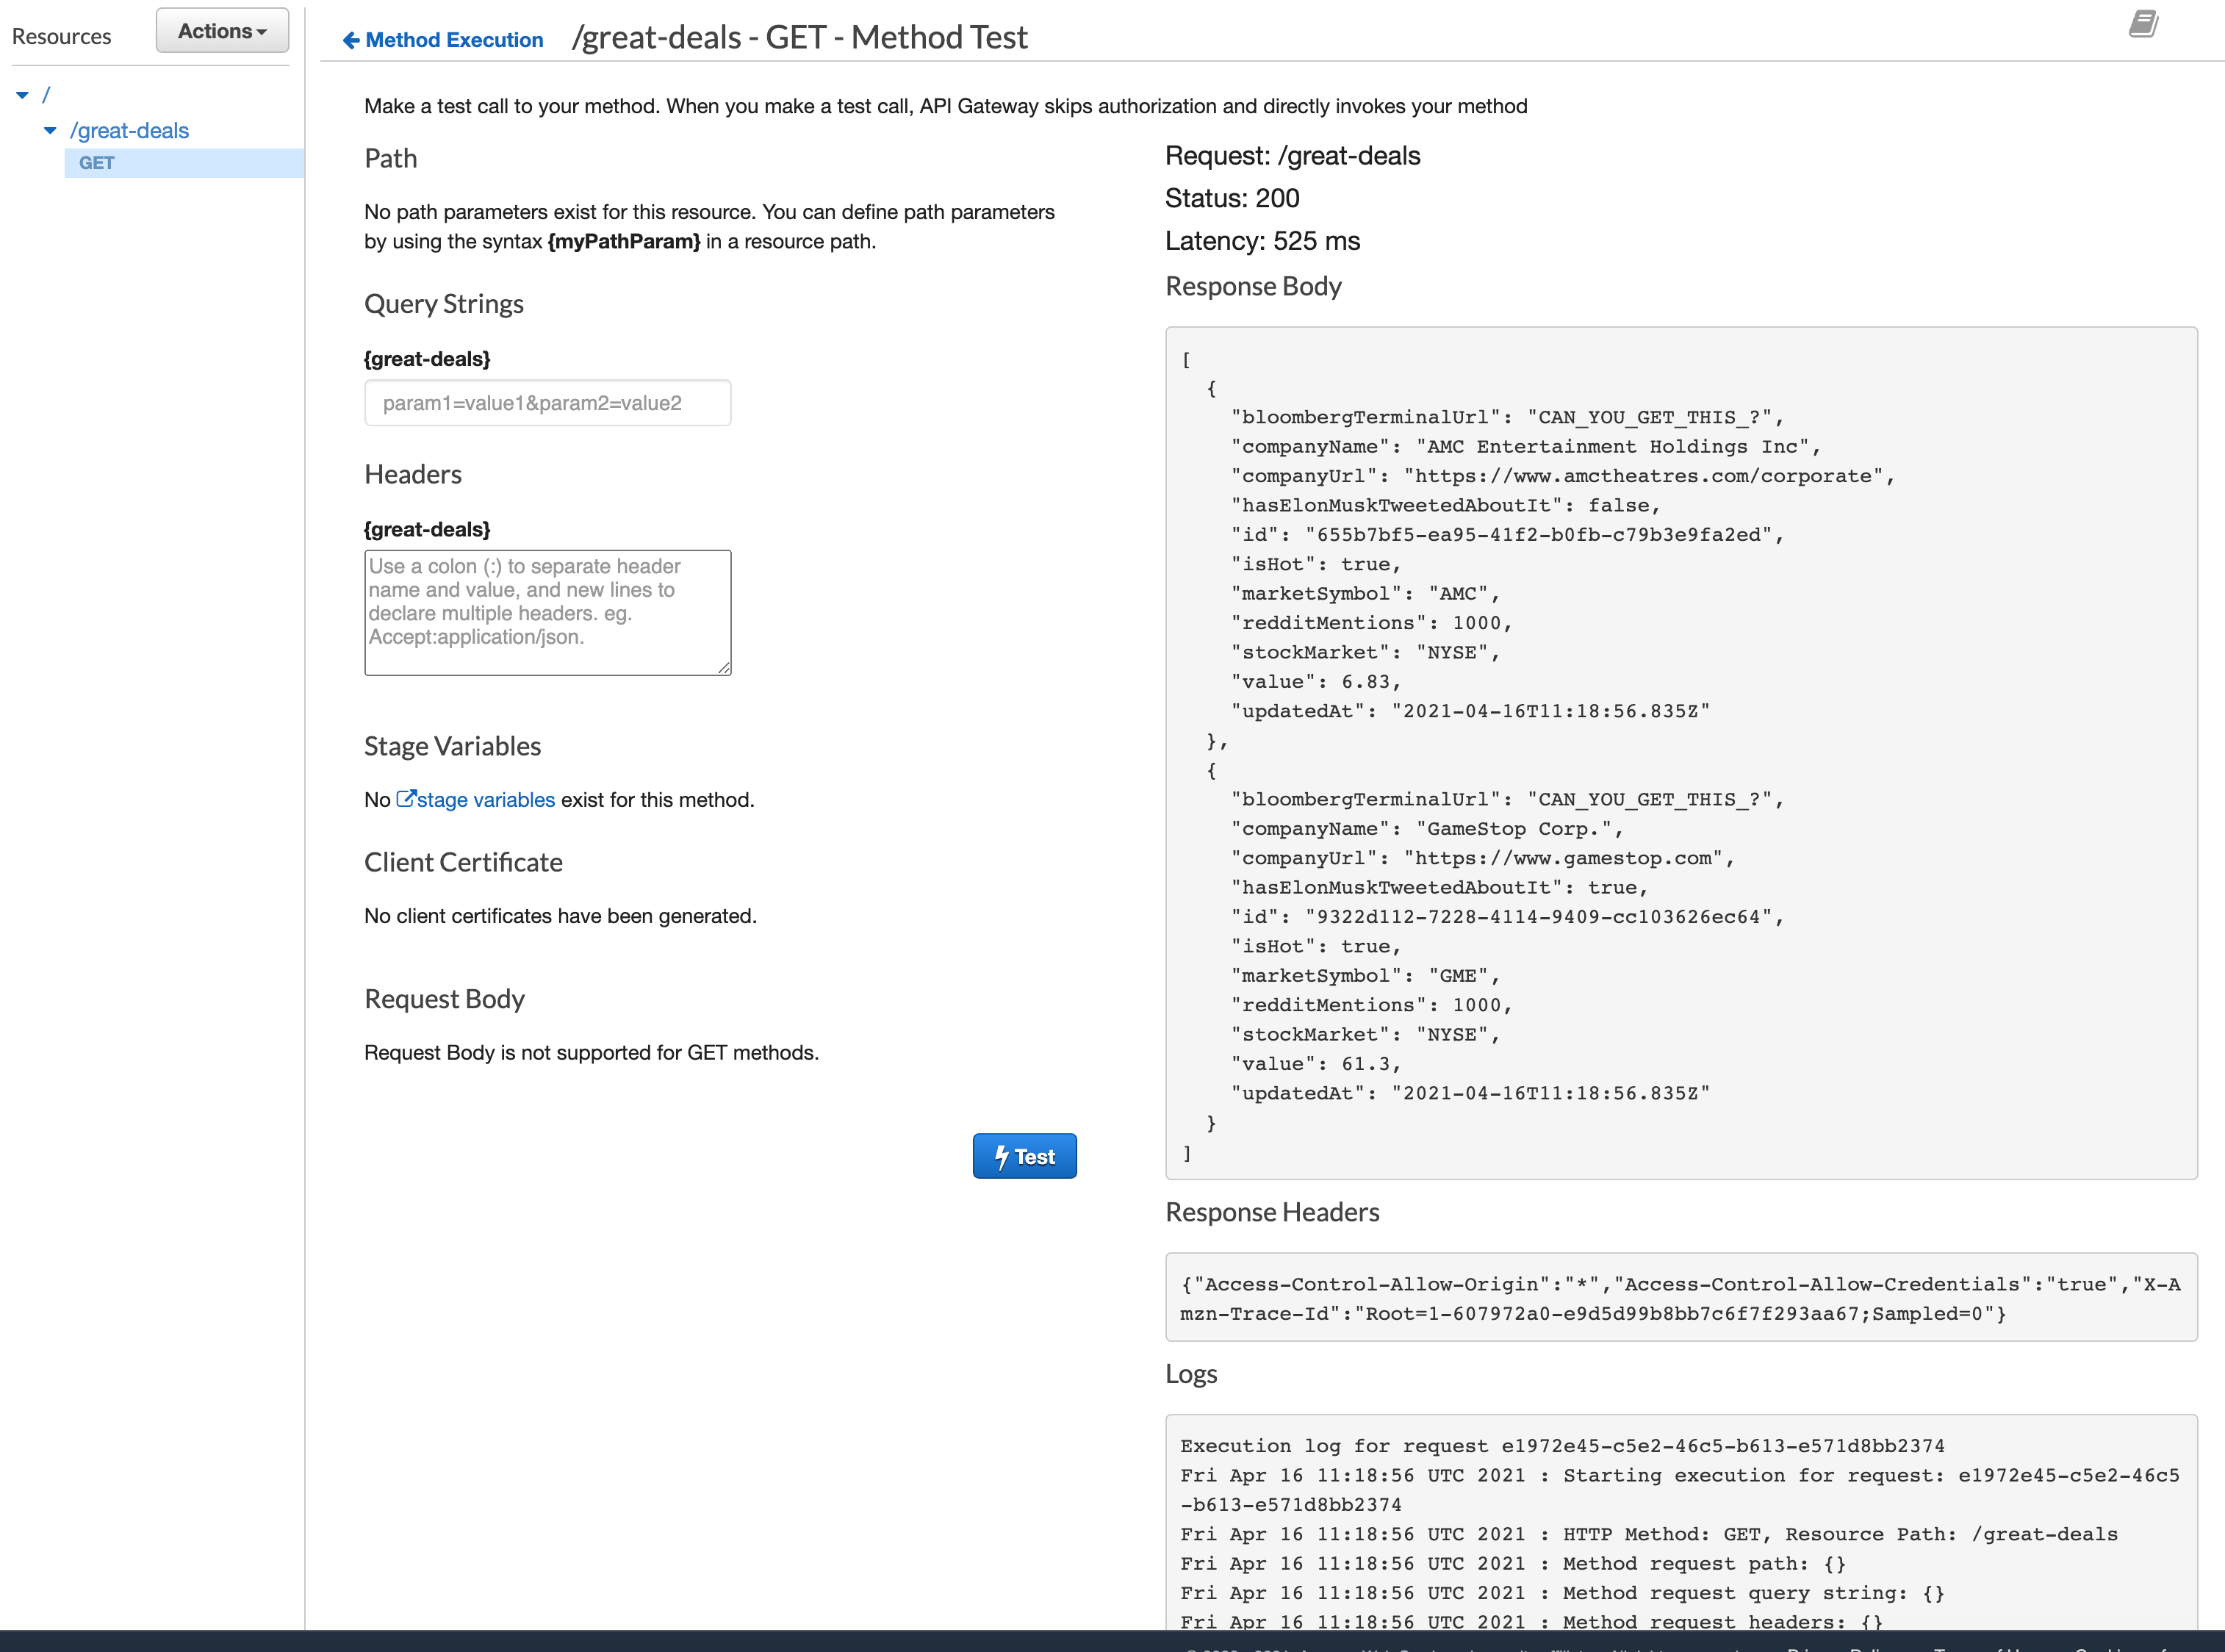 The logs that it shows are actually just the API Gateway Logs. You still need to go to the CloudWatch Logs page to view the lambda logs for the invocation.
The second way to test the lambda is directly.
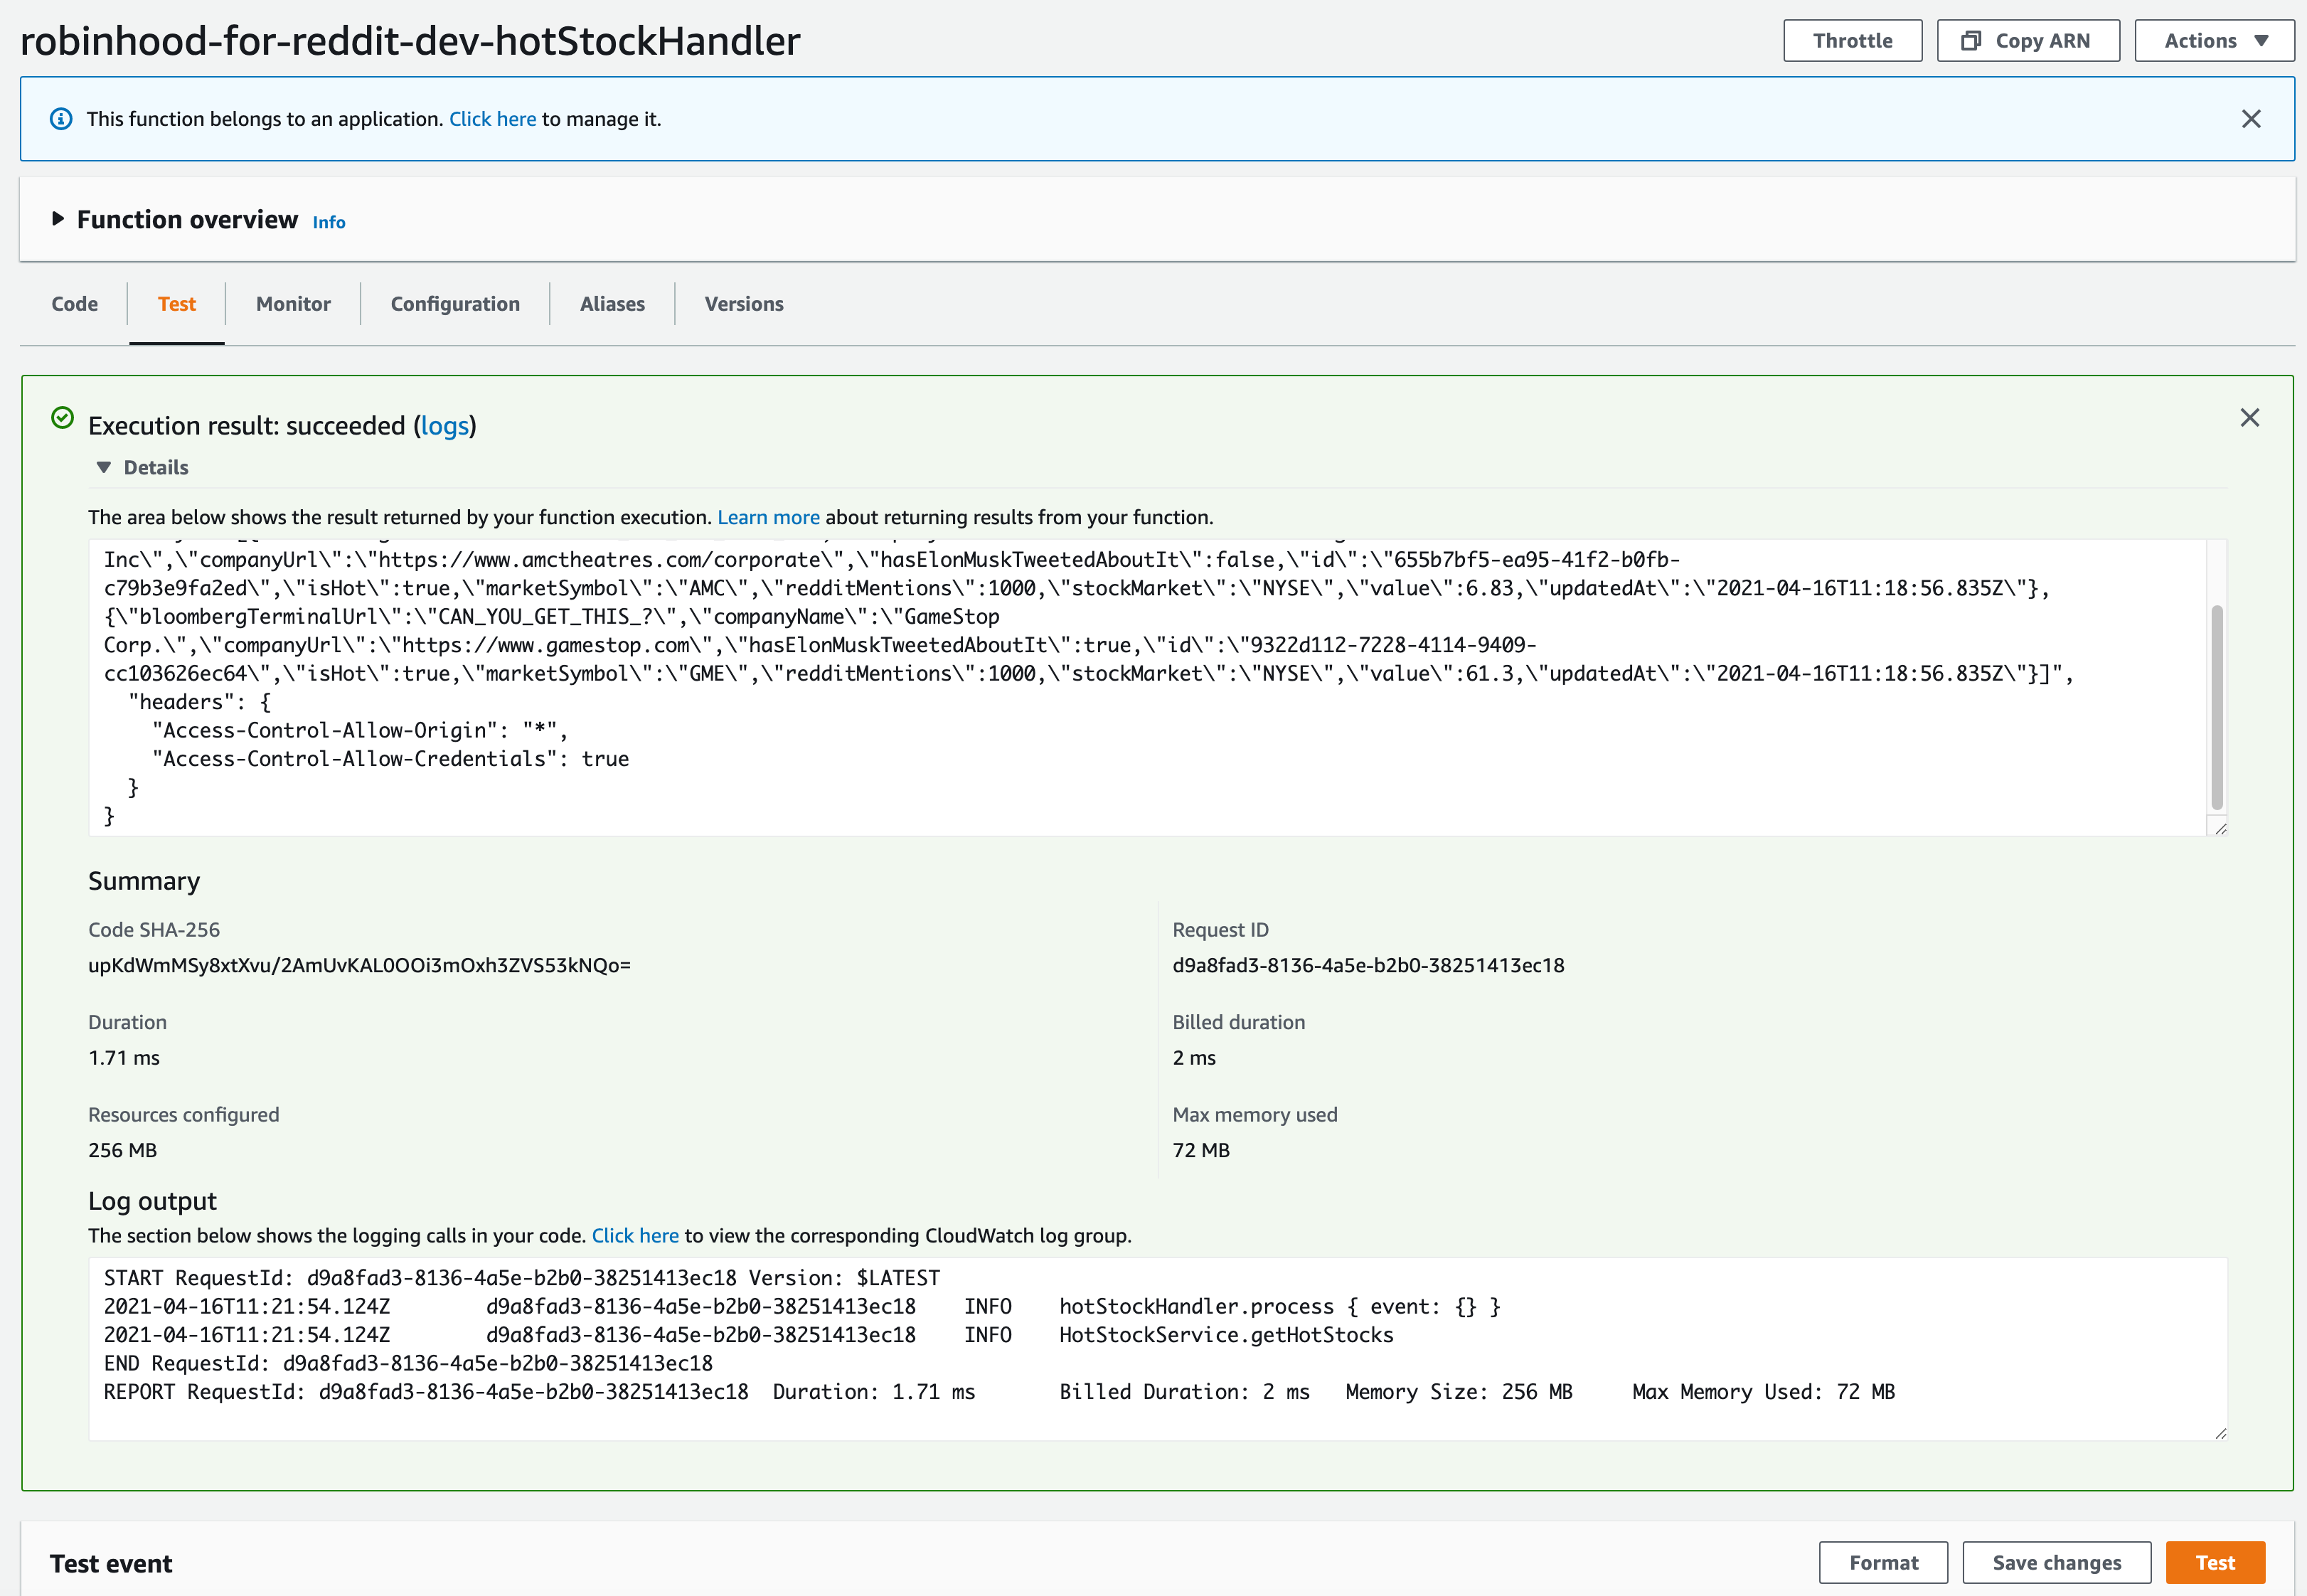
This is pretty nice because you can see the CloudWatch Logs at the bottom. You are not running it directly through the API Gateway, so you lose a bit of testing. But this is a great way to quickly test the Lambda.
# Pros
- only have to use the AWS Console
- Lambda tests can be saved for future use
# Cons
- you have to bounce around between API Gateway, Lambda, and CloudWatch Logs
- you have to use the AWS Console which can be cumbersome and often times developers may not have access to the console with their keys
# Conclusion
To recap, we believe testing is a vital part of software development, and that having tests that work and cover most use cases helps developers sleep at night. We feel that the following is how we are able to get great code coverage and observability on our systems.
- unit tests with lambda-tester and mocha for basic code coverage and function level testing
- Postman for creating collections that your dev. team can consume and use to learn the API
- Postman for testing your API Gateway or endpoints on CI/CD both before deploying using a local setup with LocalStack and then tests after the new endpoints are released
- Commandeer while you are building your code, and doing detailed testing against your deployed dev environment
- Dashbird.io for your production system, for not only the logs, but also alarms and system resource insights
- AWS Console as a fallback if you are in a pinch and can only get to the web console
Happy De
