Top 10 Use Cases for Commandeer
... About 5 min
# Top 10 Use Cases for Commandeer
Commandeer is a swiss-army knife of an IDE for managing your AWS cloud infrastructure. In this article, I want to breakdown some of the most popular use cases that we see it being used for.
Download the Commandeer App - 15-day Free Trial - The #1 developer IDE to manage your serverless and container infrastructures, both locally and in the cloud. With support for 30+ of the best cloud services out there.
# 1. Viewing your DynamoDB data
NoSQL is amazing to code against. It enables you to keep a loose structure around your data. But, when you have to view the data, that is where it gets tricky. We enable you to query, scan, truncate, and view related data in a simple to use IDE. So, while you are working through your coding, you can easily see the end results, look up data efficiently, and overall get a better understanding. It works the exact way against AWS and it does LocalStack as well.
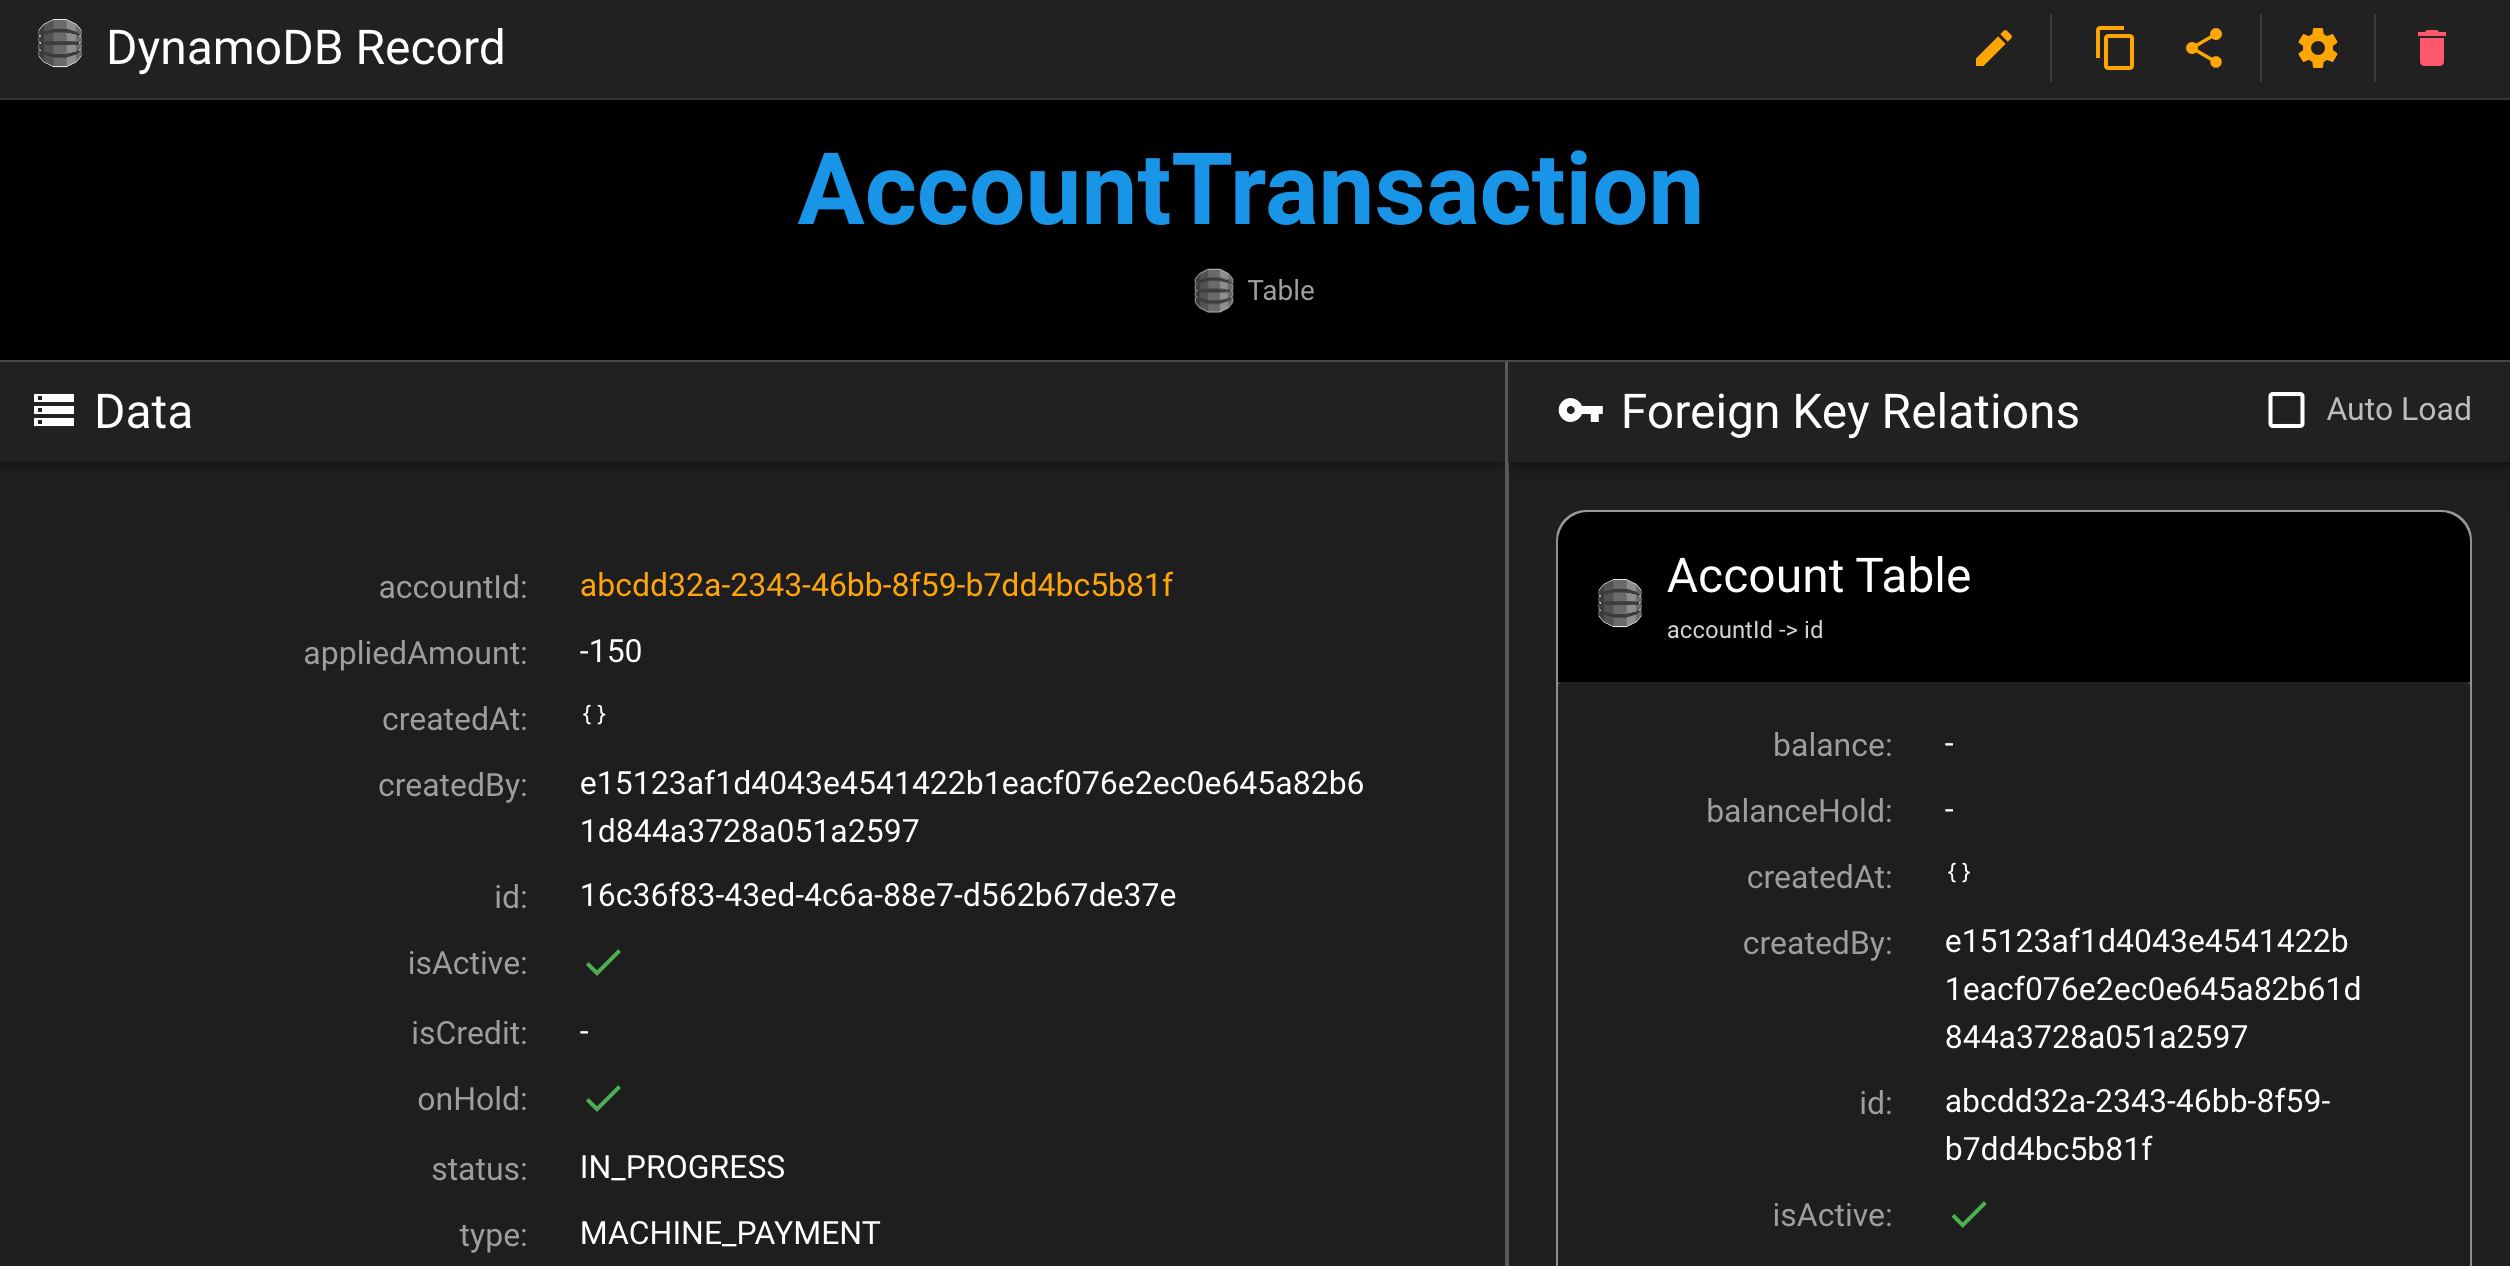
Viewing a DynamoDB record with related table information
# 2. Viewing your S3 data
S3 is the de facto way to store flat files in the cloud. It is extremely powerful in that it has a wonderful API, can connect to Lambda's for event-driven programming, and can even power data lakes with Athena. Up until now however, you had to use a mish mash of tools to manage it. With Commandeer, you can view your files, edit them in place, download and upload, and test out your Lambda connections.
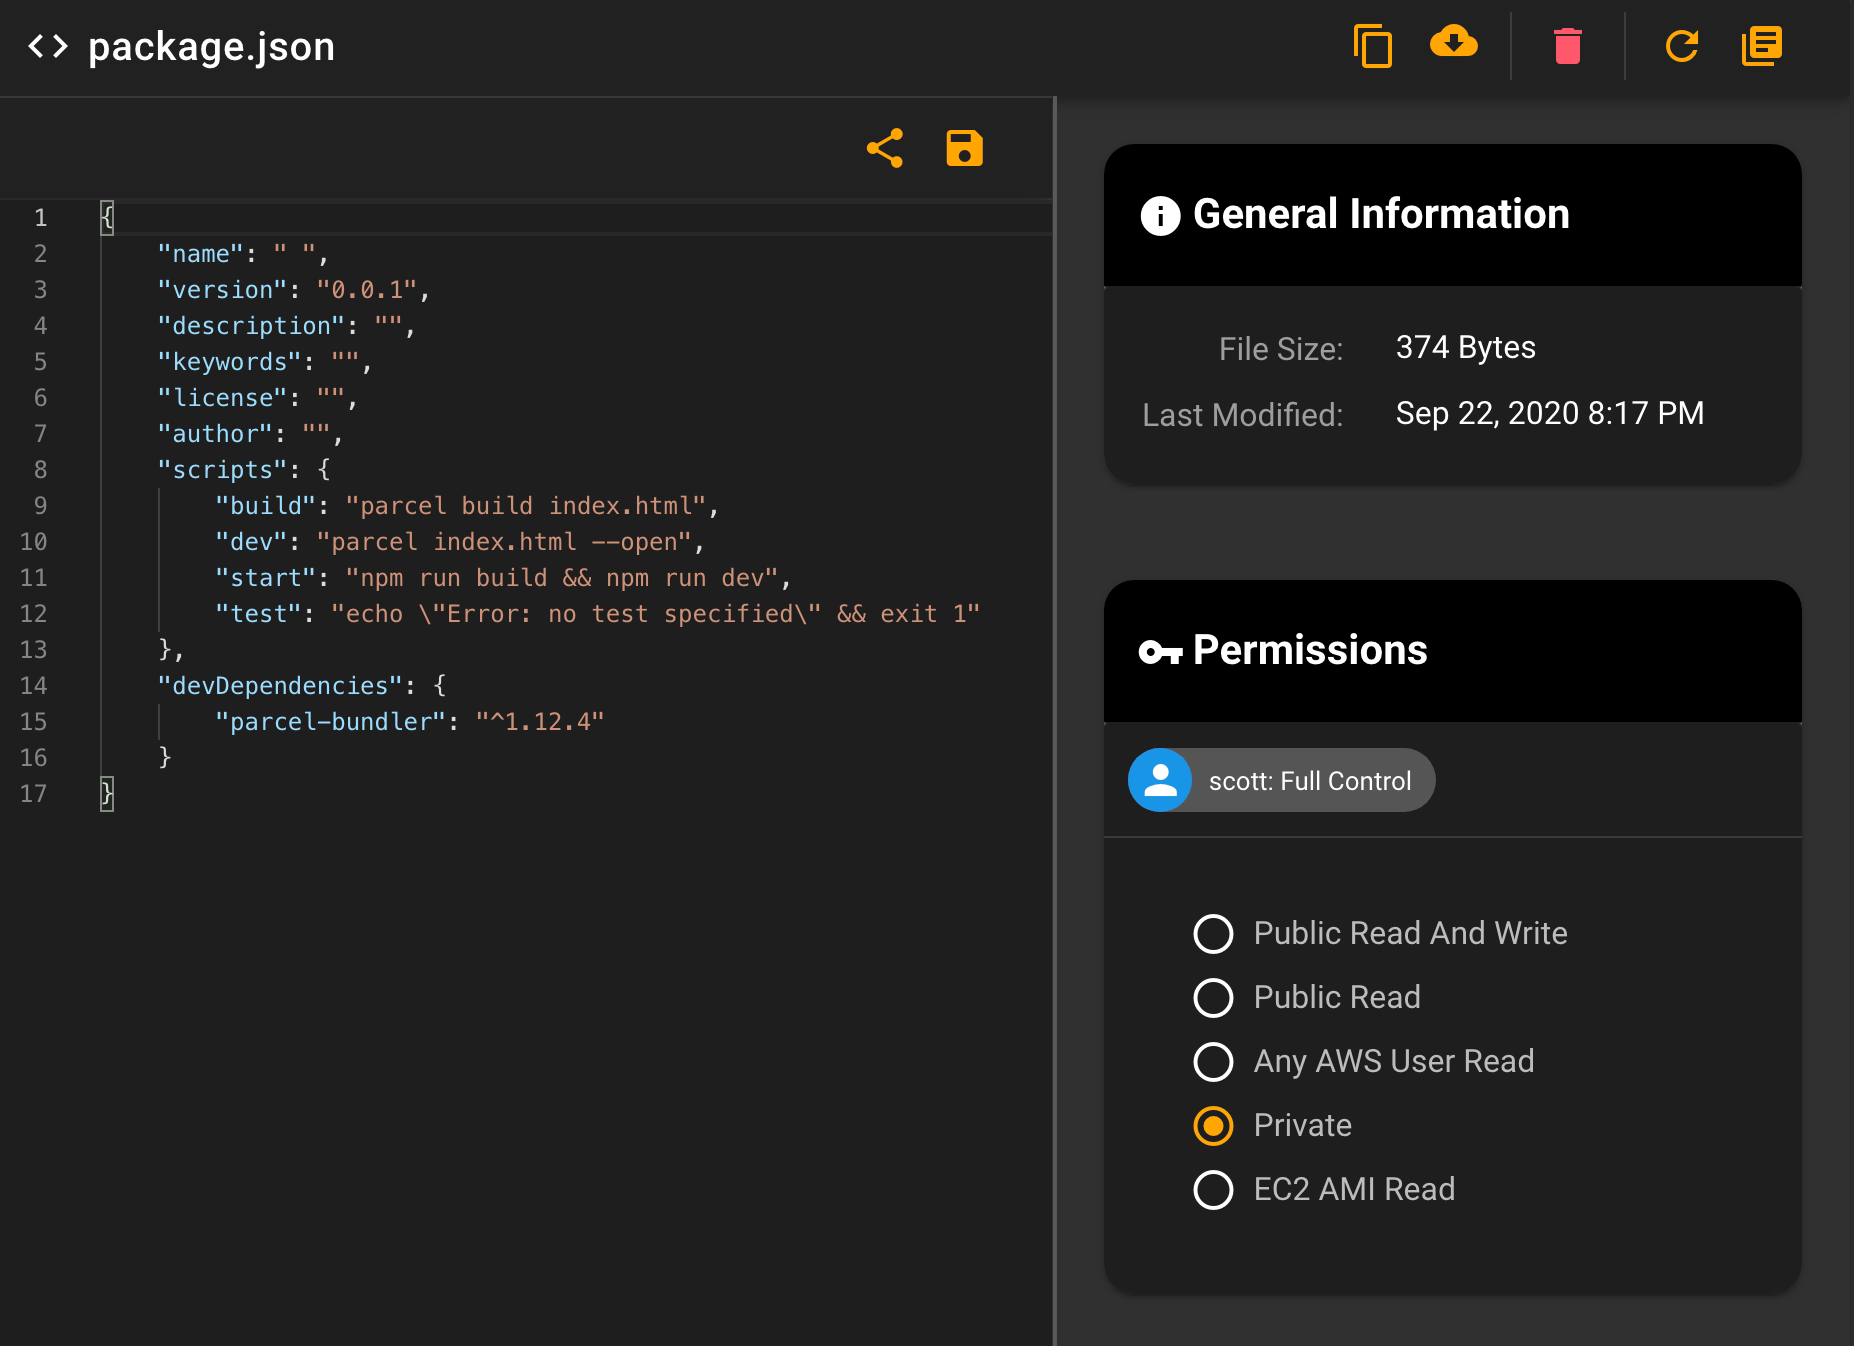
Editing a package.json file in S3
# 3. Managing your LocalStack environments
LocalStack enables you to have a mock AWS environment. We have customers using this in some really cool ways. For instance, they might have multiple LocalStack docker containers running that connect to different accounts, and some are even hosting a LocalStack instance on ECS so that their dev teams can test against AWS, but not incur the cost.
Commandeer provides a sophisticated dashboard that sits on top of LocalStack and provides you all the tools you need for swithcing containers, starting and stopping services, and most importantly viewing ALL your data in S3, DynamoDB, CloudWatch Logs, etc. in the same way that you view them for AWS.
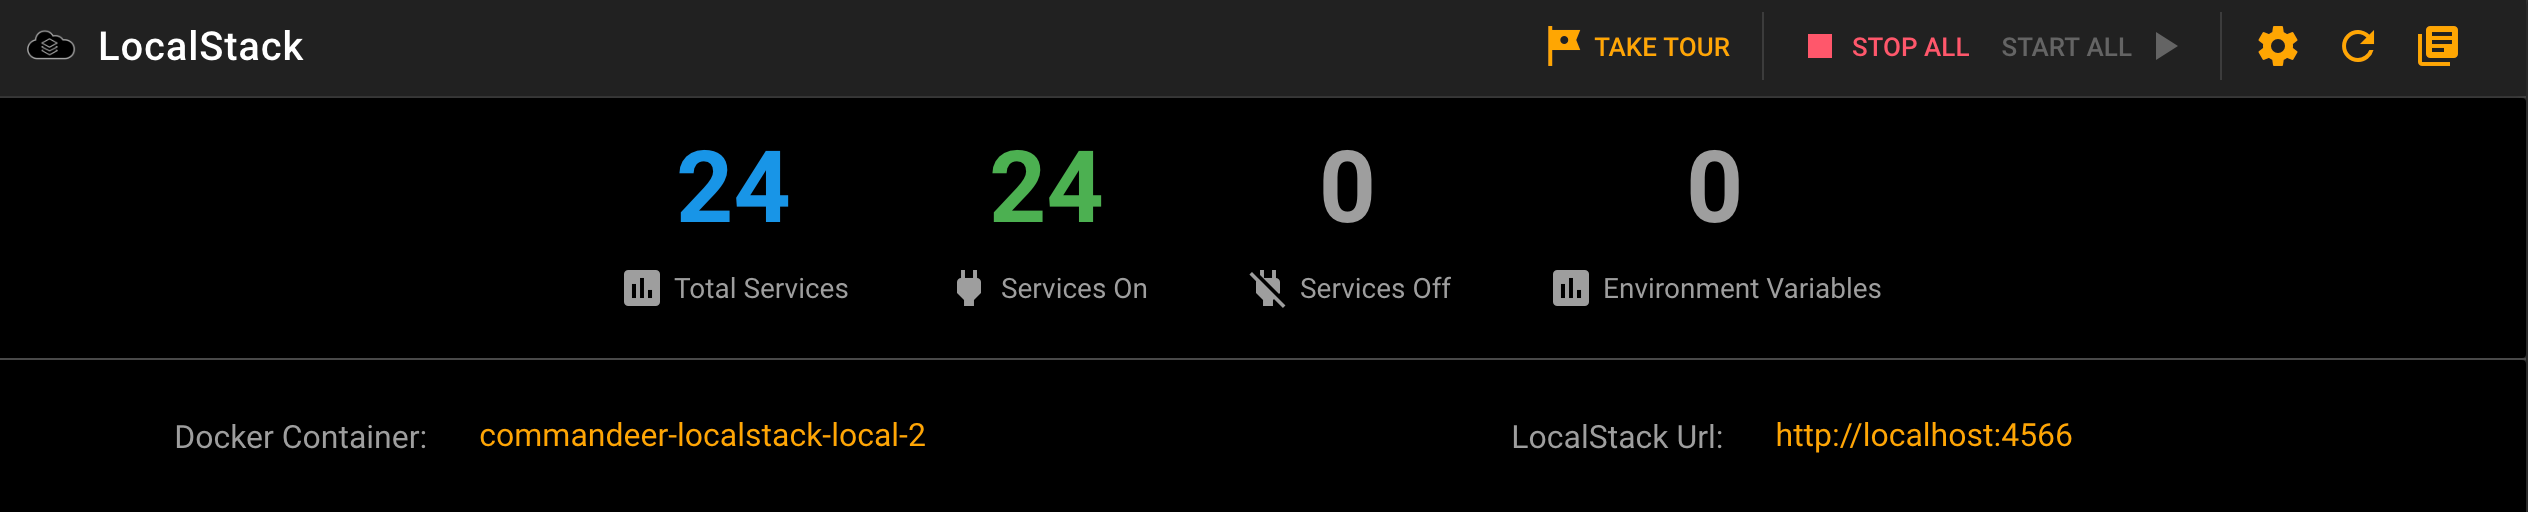
LocalStack Dashboard
# 4. Testing out Lambda connections
Lambda is the backbone of serverless event-driven programming. It is a little piece, or sometimes big piece of code you write, that AWS guarantees will run when you trigger an event. An event could be a file saved to S3, a DynamoDB Stream that fires every time a record is altered in a table, an api call from API Gateway or AppSync, or processing items in SQS queues.
You normally deploy them via an IaC tool like Serverless Framework, but up until now, you had to test them in a variety of methods. You might use one tool to test API Gateway, and then unit tests to test the Lambda directly. With our suite of testing tools, you can trigger the actual event, and see the Lambda Invocation logs immediately.
Uploading a file to S3 and viewing the invoked Lambda
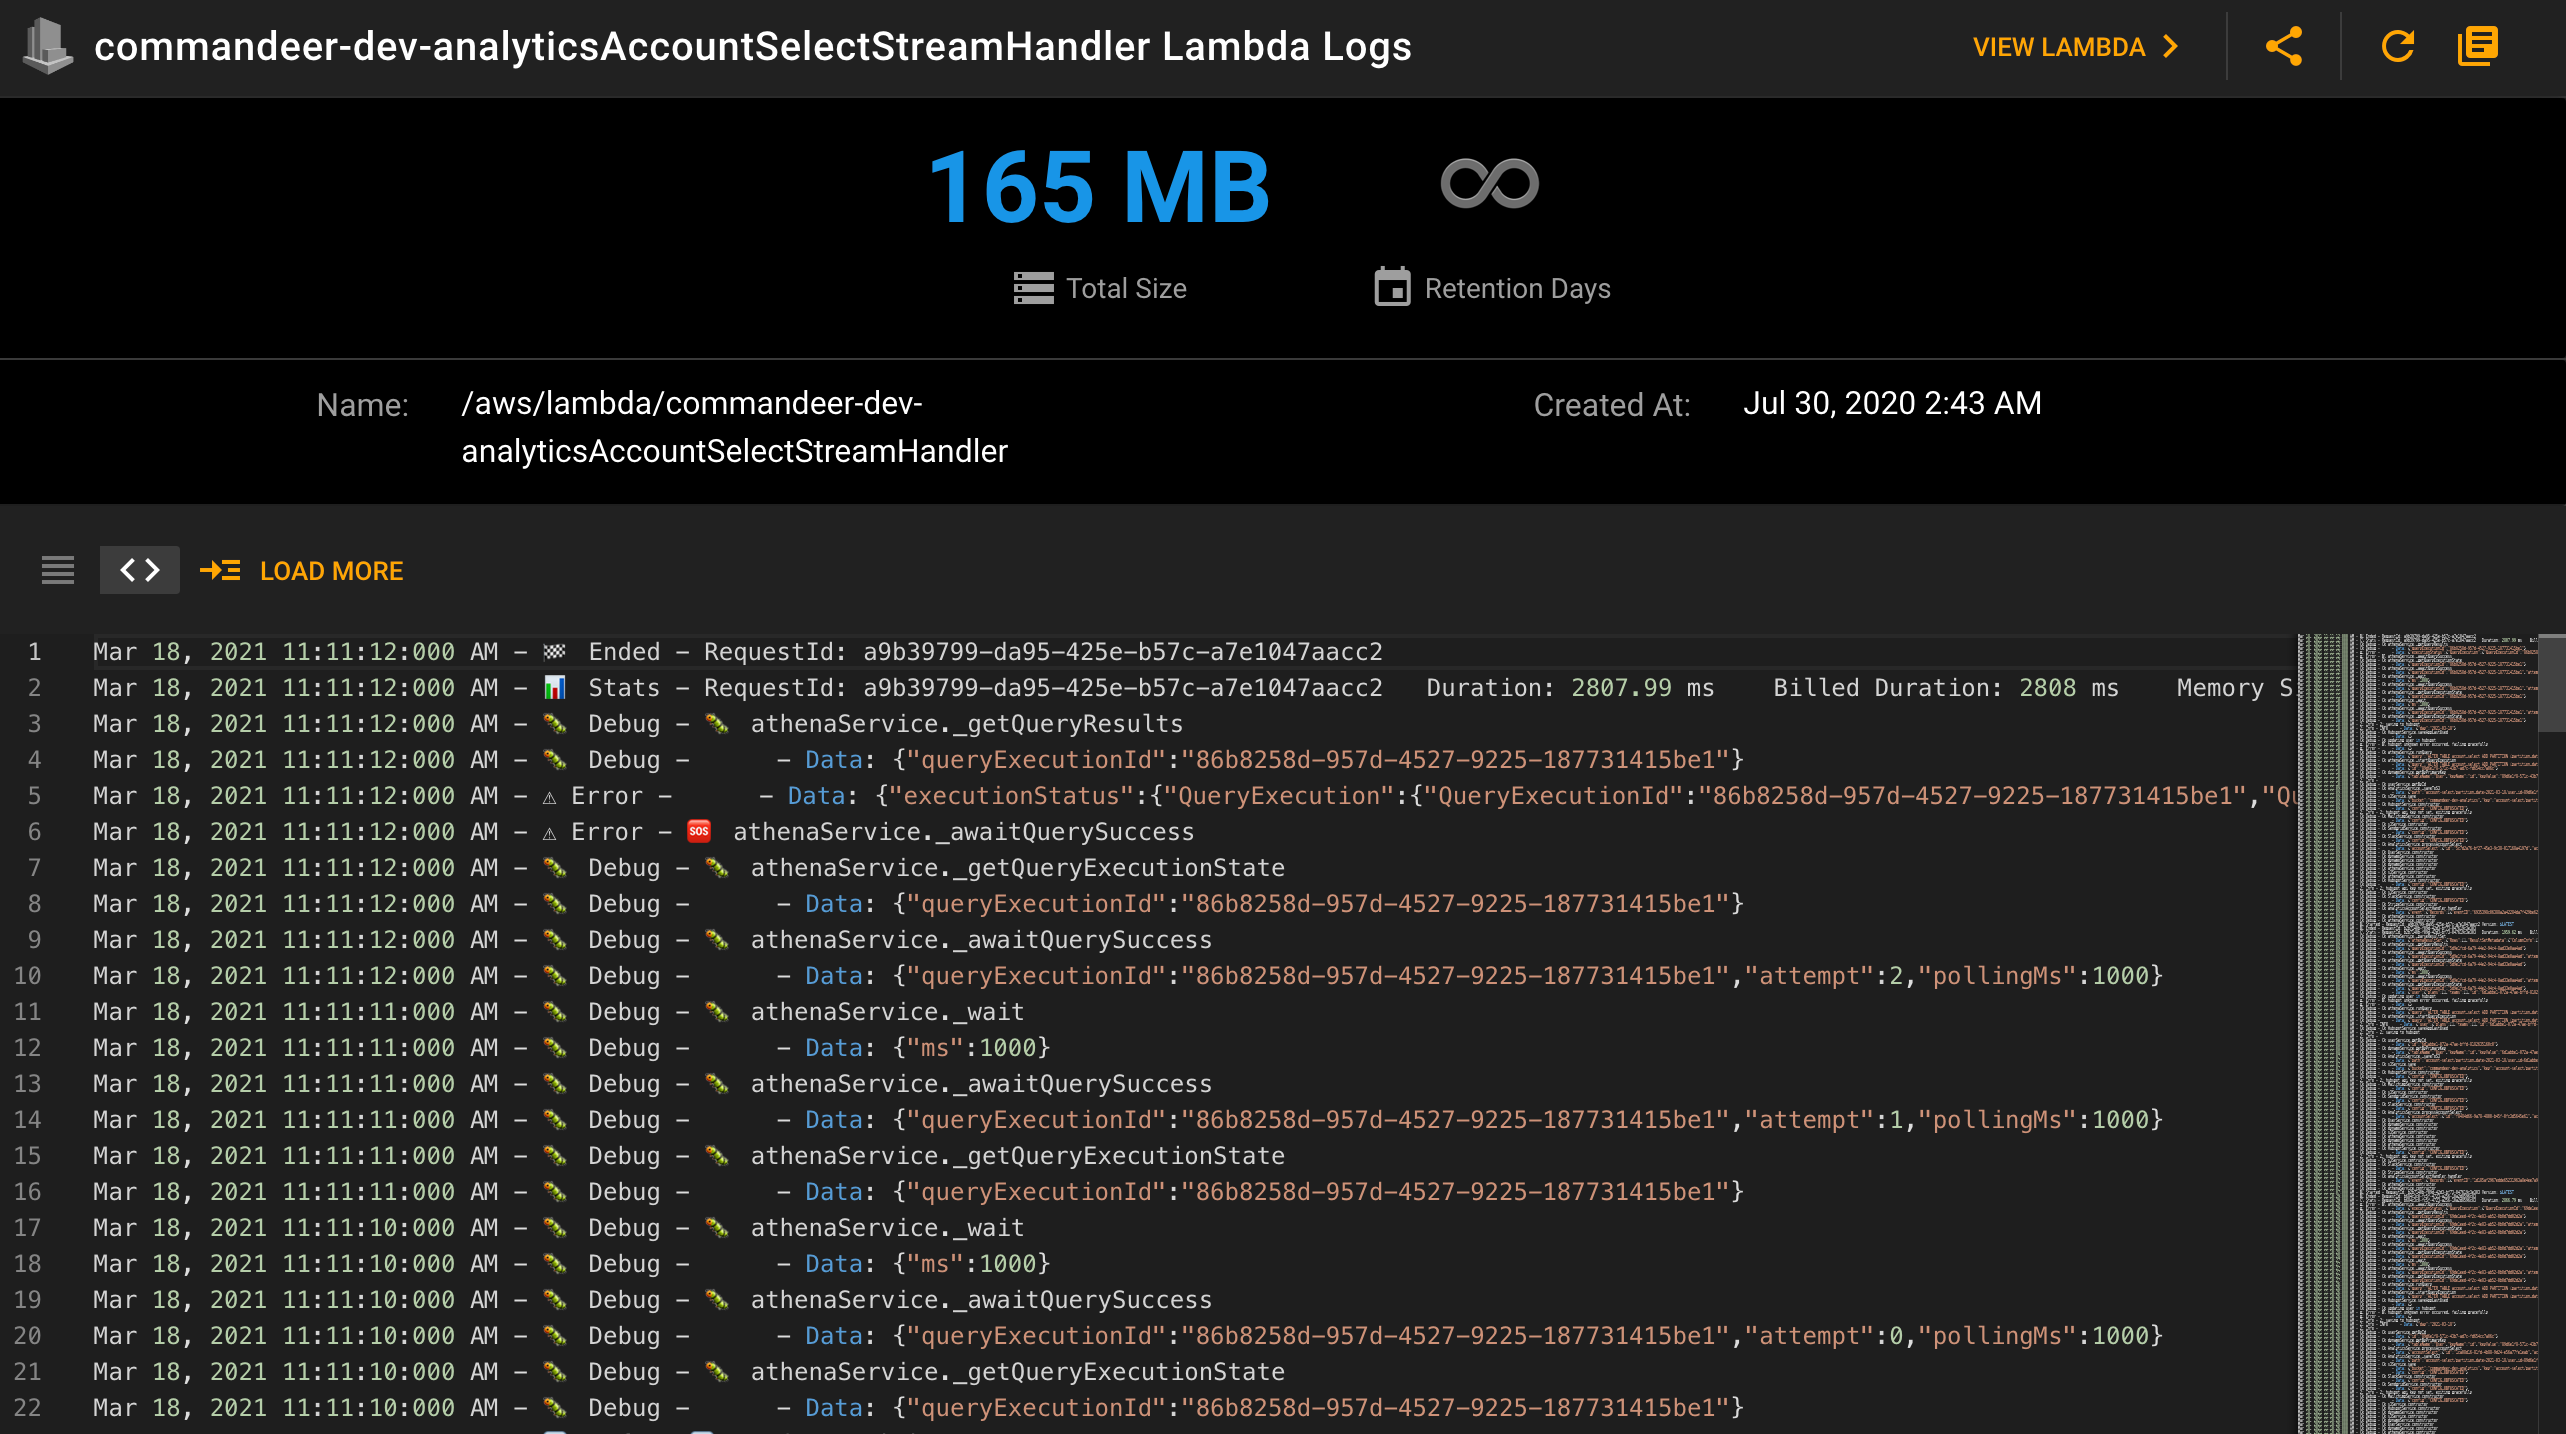
# 5. Viewing your CloudWatch Logs
This one piggy backs on top of testing your Lambda's. Logging is one of the key pieces of being able to monitor your system's health in an event-driven paradigm. If you have an app that you are developing, and it is hitting the API Gateway for instance, you can easily view your invocation logs in Commandeer. Seeing log output is often the difference between flying blind in a system, or truly understanding what you are developing in real-time.
# 6. Sharing your ER and System Diagrams
Understanding a Serverless and Container based system has been pretty hit or miss since it's inception. There are very few tools that give you a true up to the minute birds-eye-view of your system. Most systems depend on pictures of whiteboard drawings, or out of date diagrams done by a systems architect at the beginning of the project.
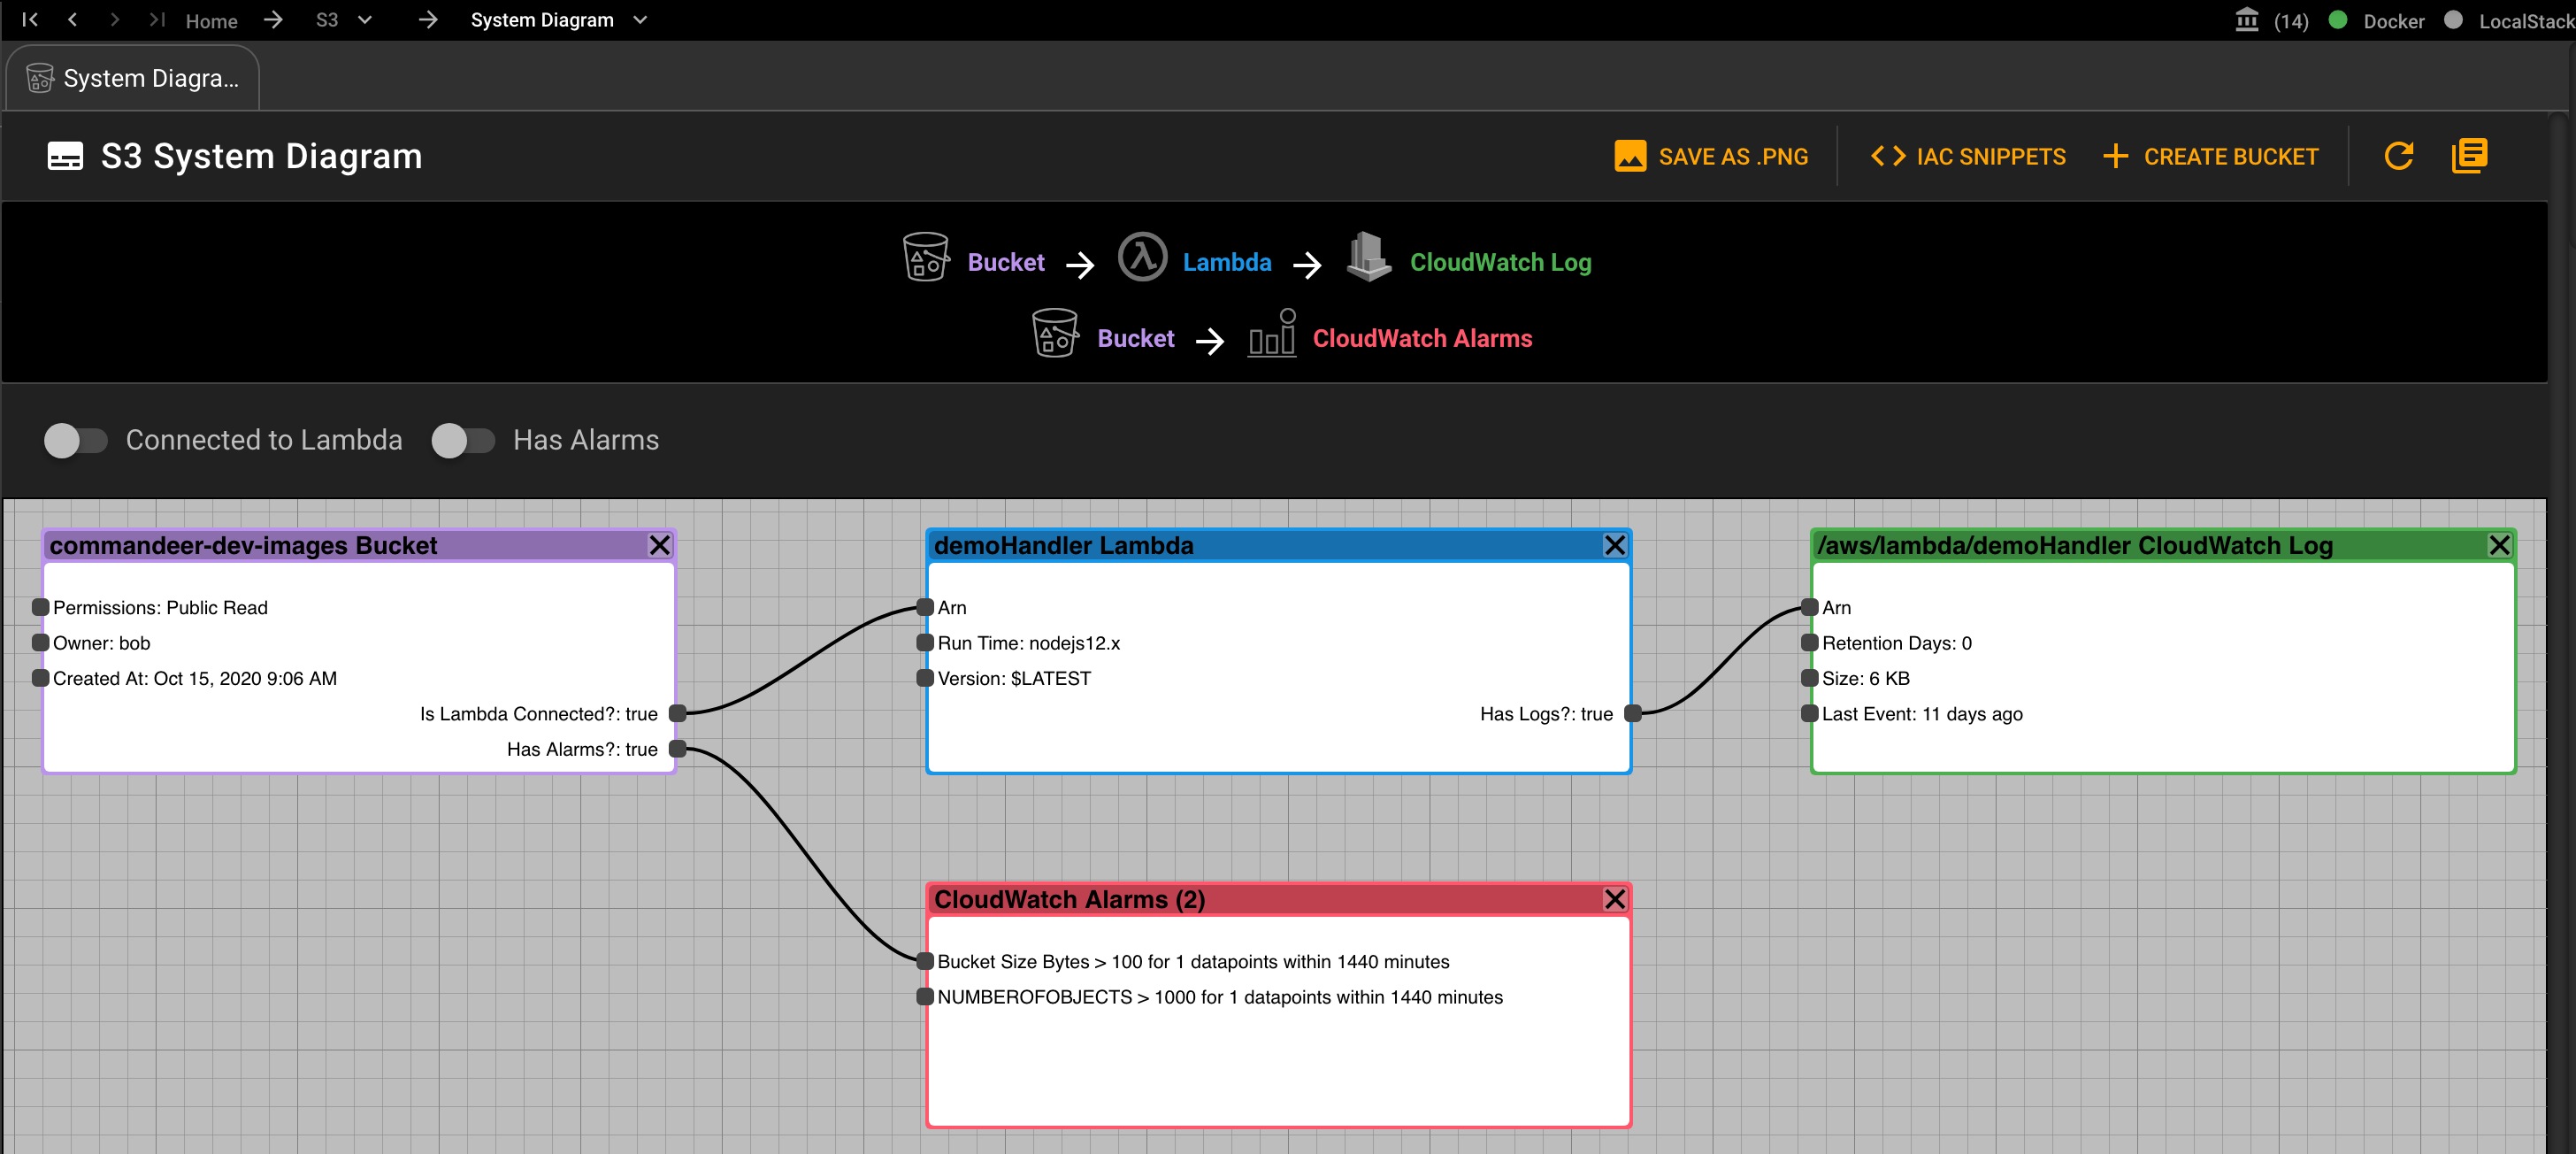
Viewing connections between S3 buckets, Lambda, and CloudWatch Alarms & Logs
Our suite of ER Diagrams for PostgreSQL, Redshift, Athena, DynamoDB, and Algolia provide you with data models that are otherwise often unknown. And our System Diagrams for your connections between S3, DynamoDB, SQS, SNS, and Lambdas, CloudWatch Logs, and CloudWatch Alarms provides you the in-depth understanding of your system that your whole team has been missing. There is also diagrams for Docker to provide a deeper insight into how your docker environment is configured.
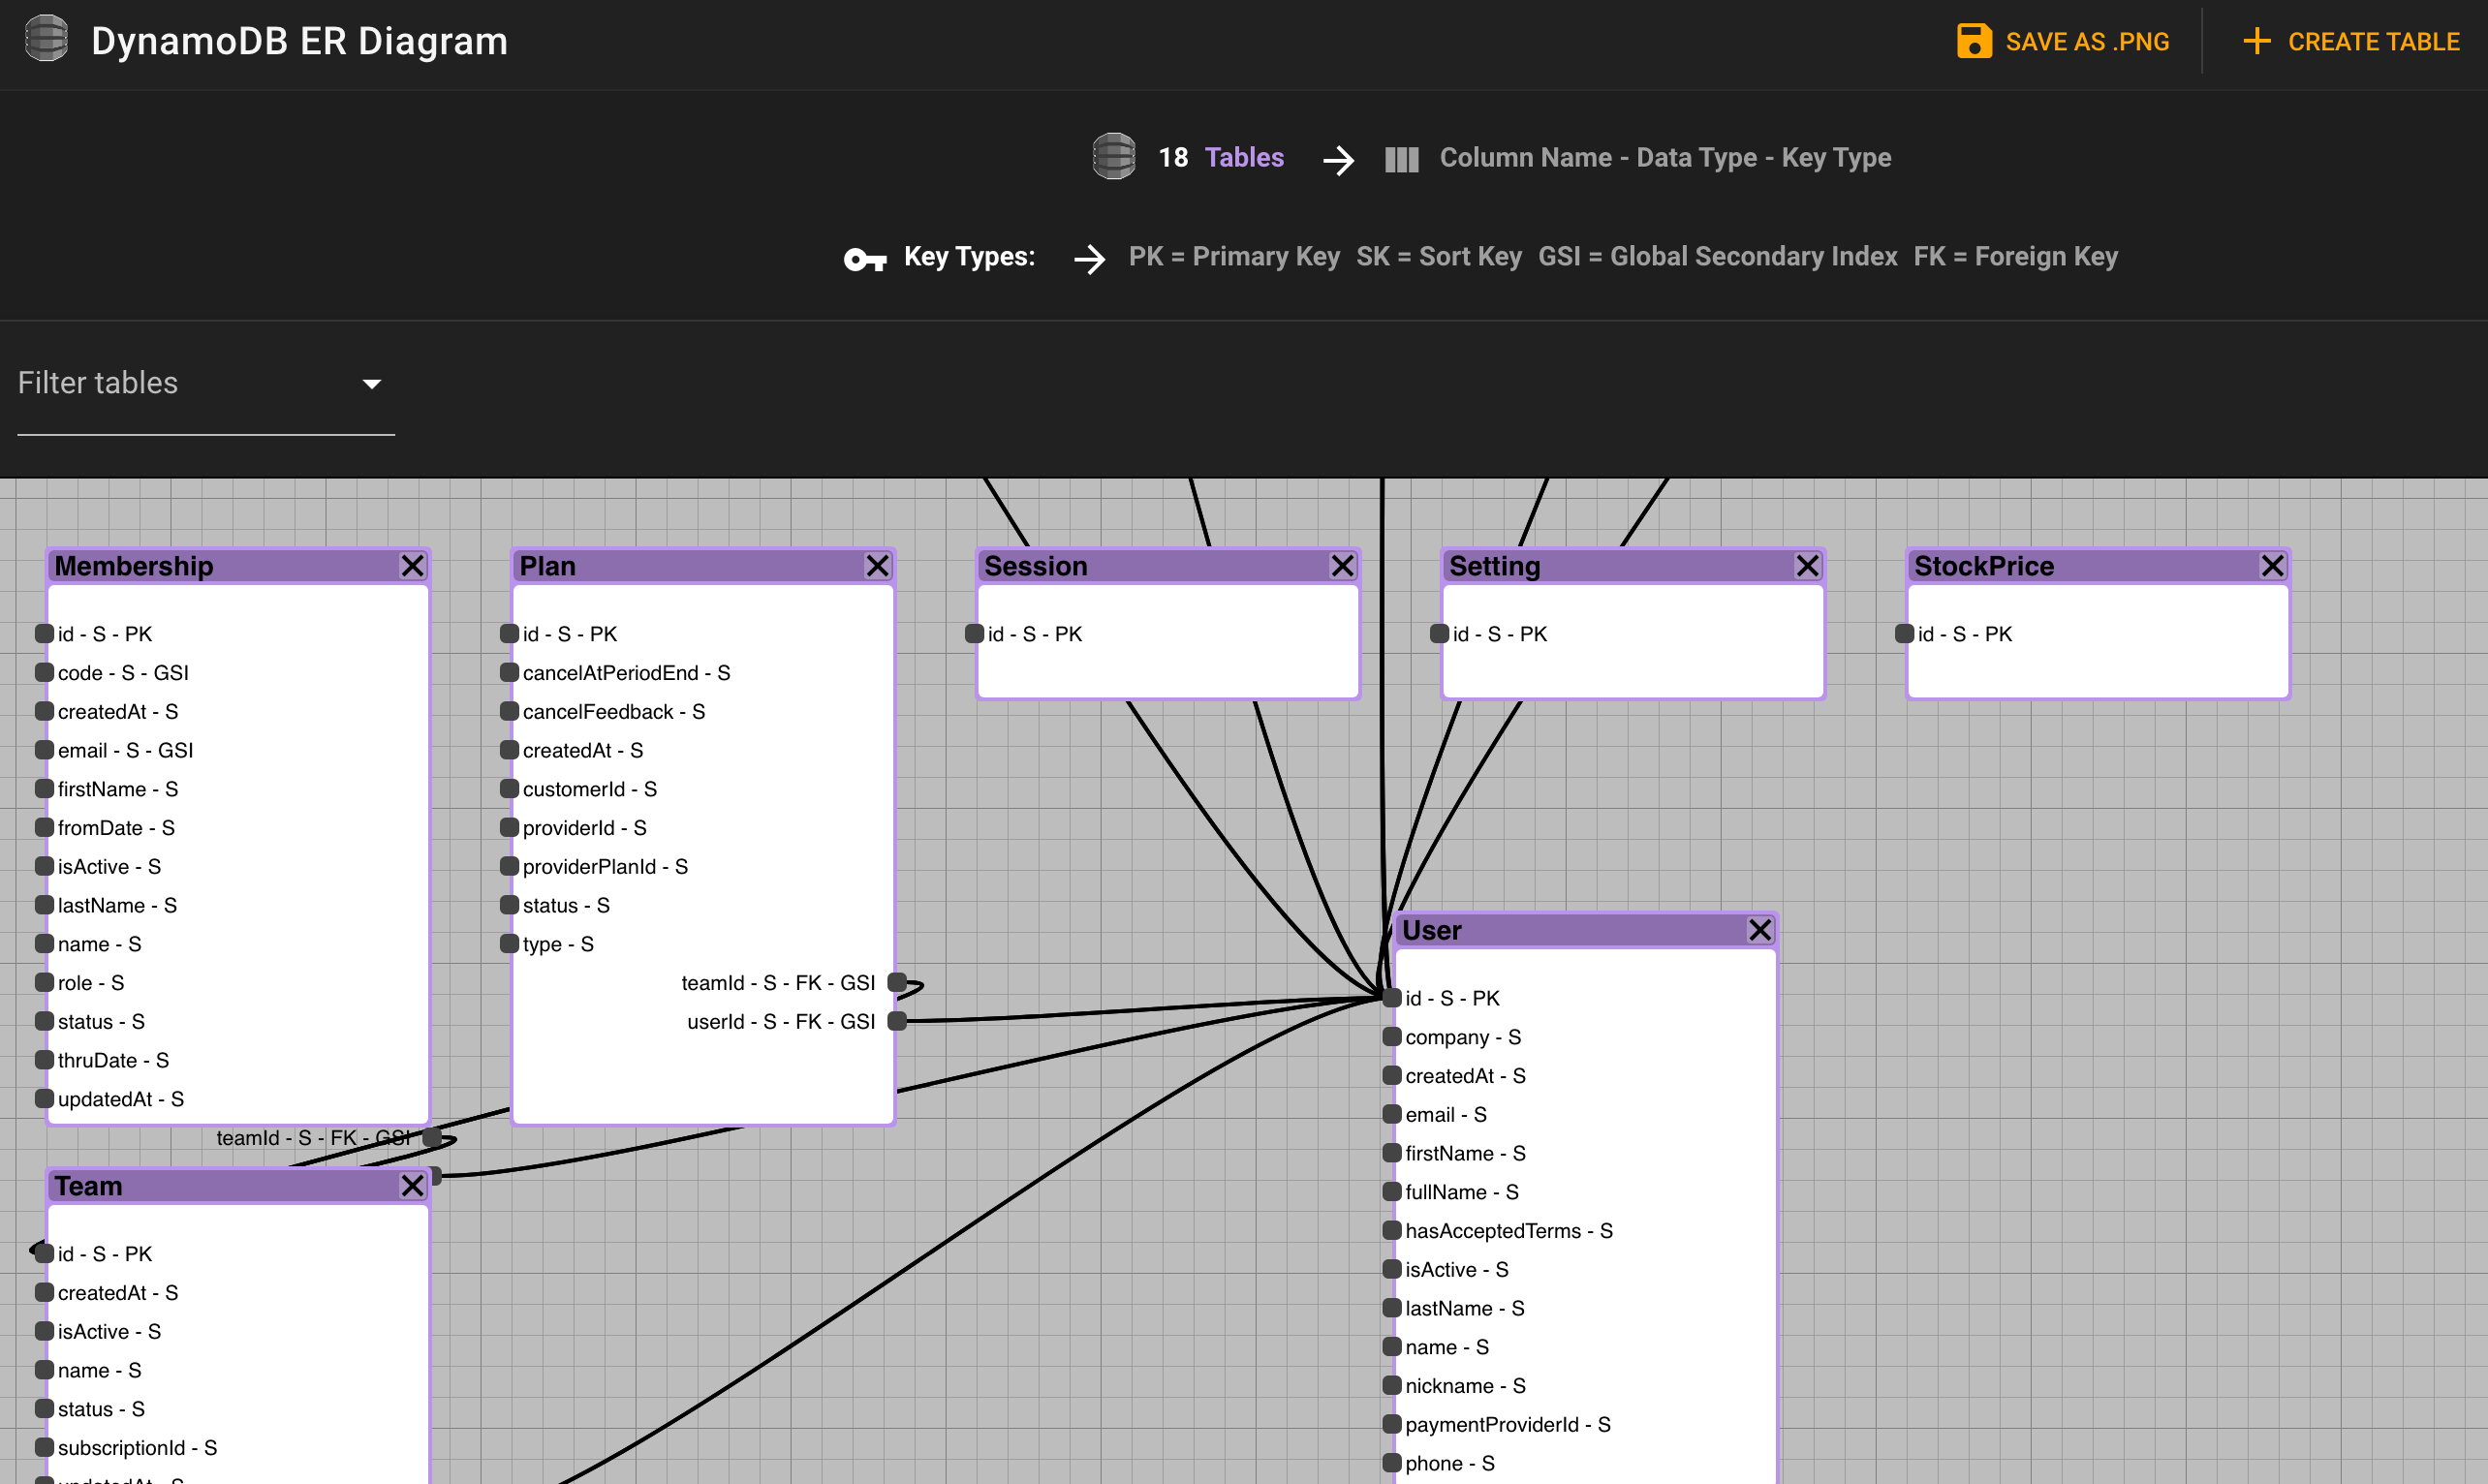
DynamoDB ER Diagram
# 7. Querying data in PostgreSQL, Athena, and Redshift
For most developers, querying SQL just needs two things. A solid interface to type in your query, and a query history so you can see previous queries you have run. Our tooling allows these. It is simple, elegant, and now if you are working on big data projects, you can actually query while you work. Meaning, you might be pumping data into RedShift, and now you can actually see waht that data is looking like without having to use yet another tool.
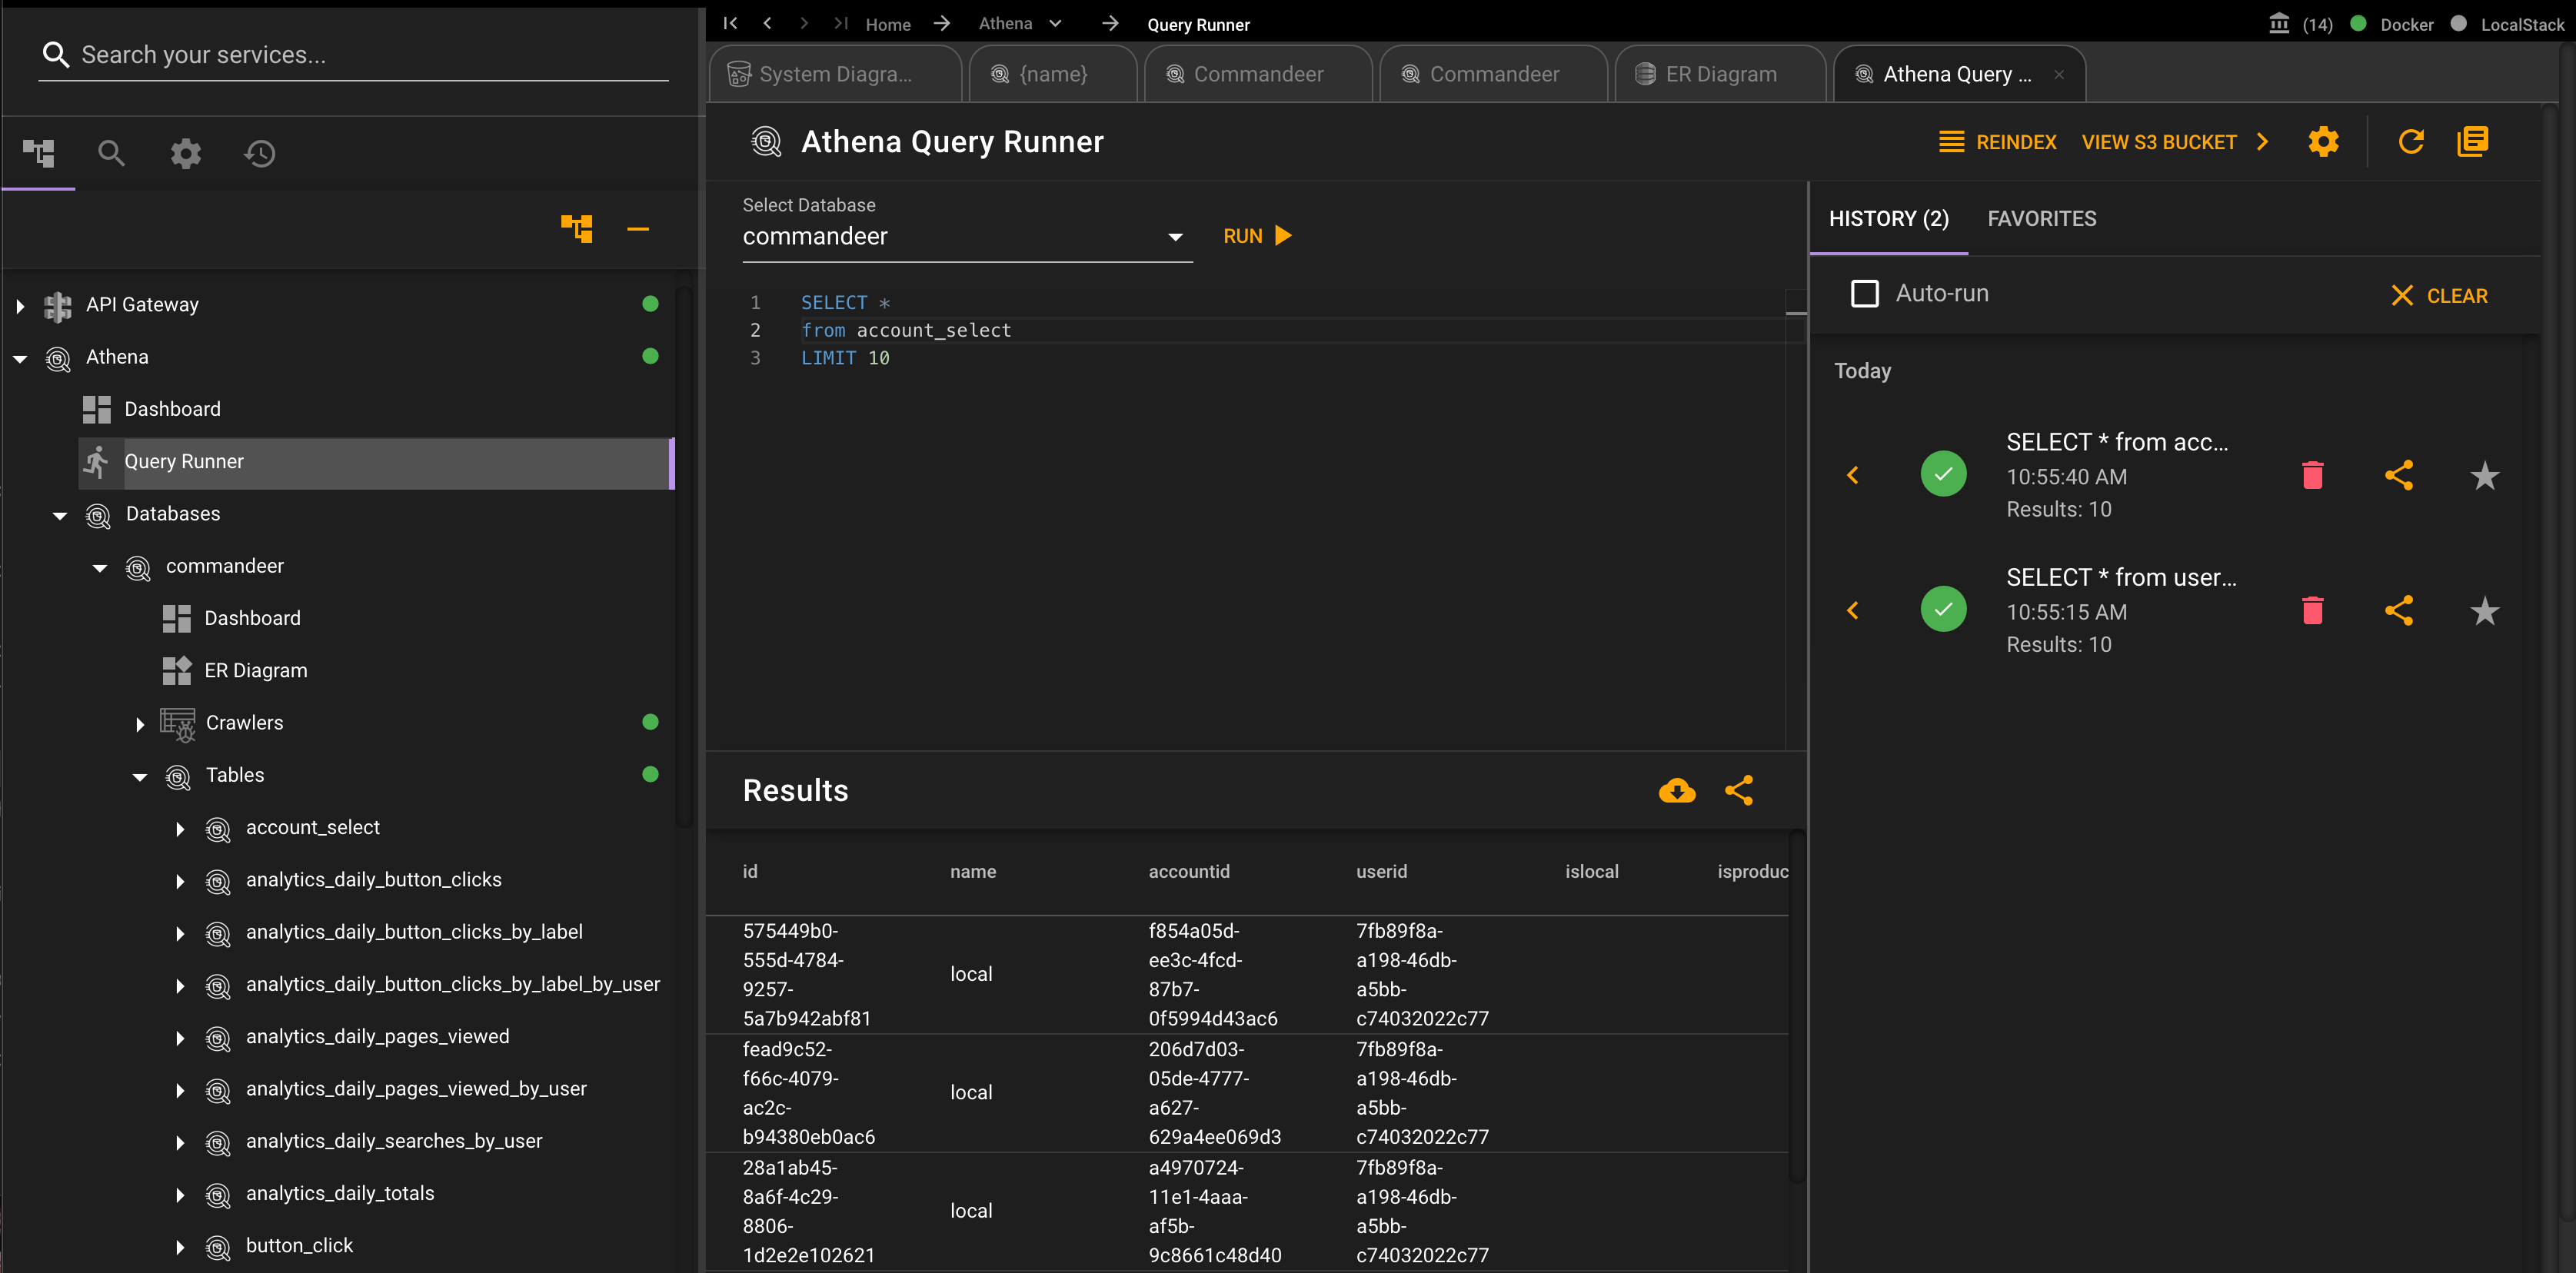
Querying your Athena Data Lake
# 8. Testing out your SQS Queueing System
Queues are great, especially now that you can have a Lambda connected to your queue to do the processing. No more polling! But visualizing it has been very difficult before Commandeer. Now you can simply create a queue, put records in it, and see the invocation CloudWatch logs of the lambdas. So you can perform the entire plumbing checks in your development environment quickly and easily.
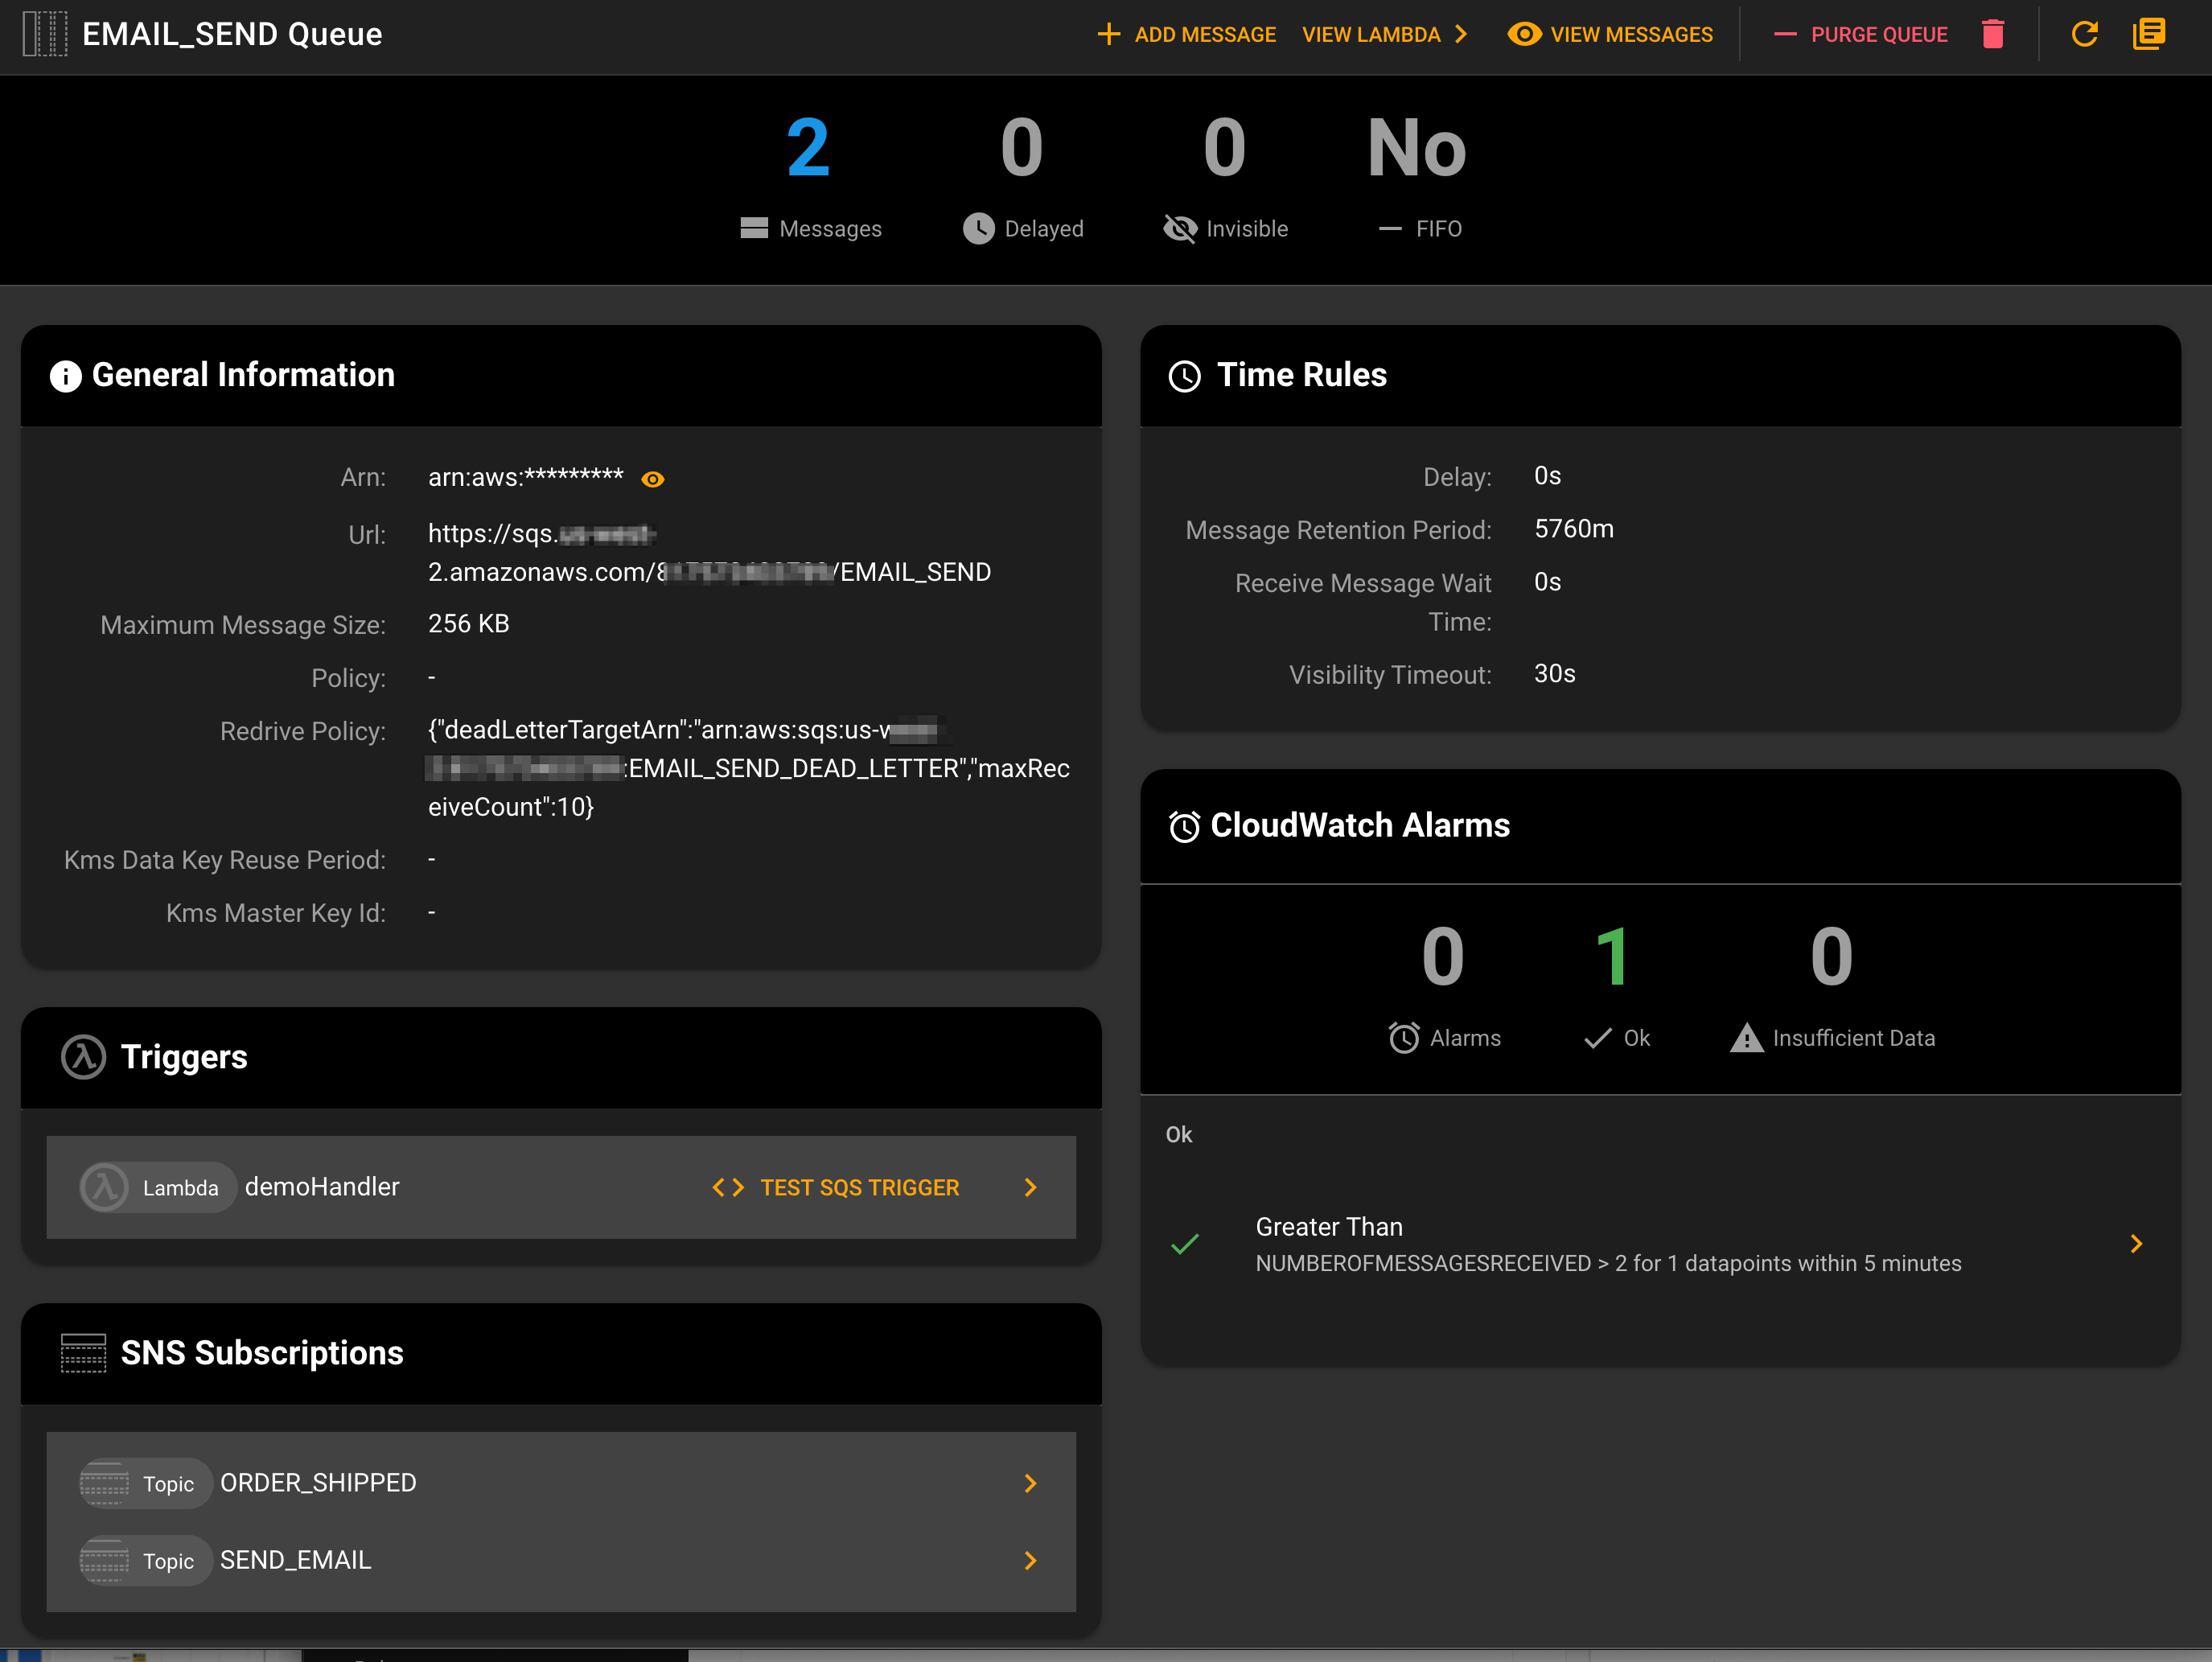
EMAIL_SEND SQS Queue Dashboard
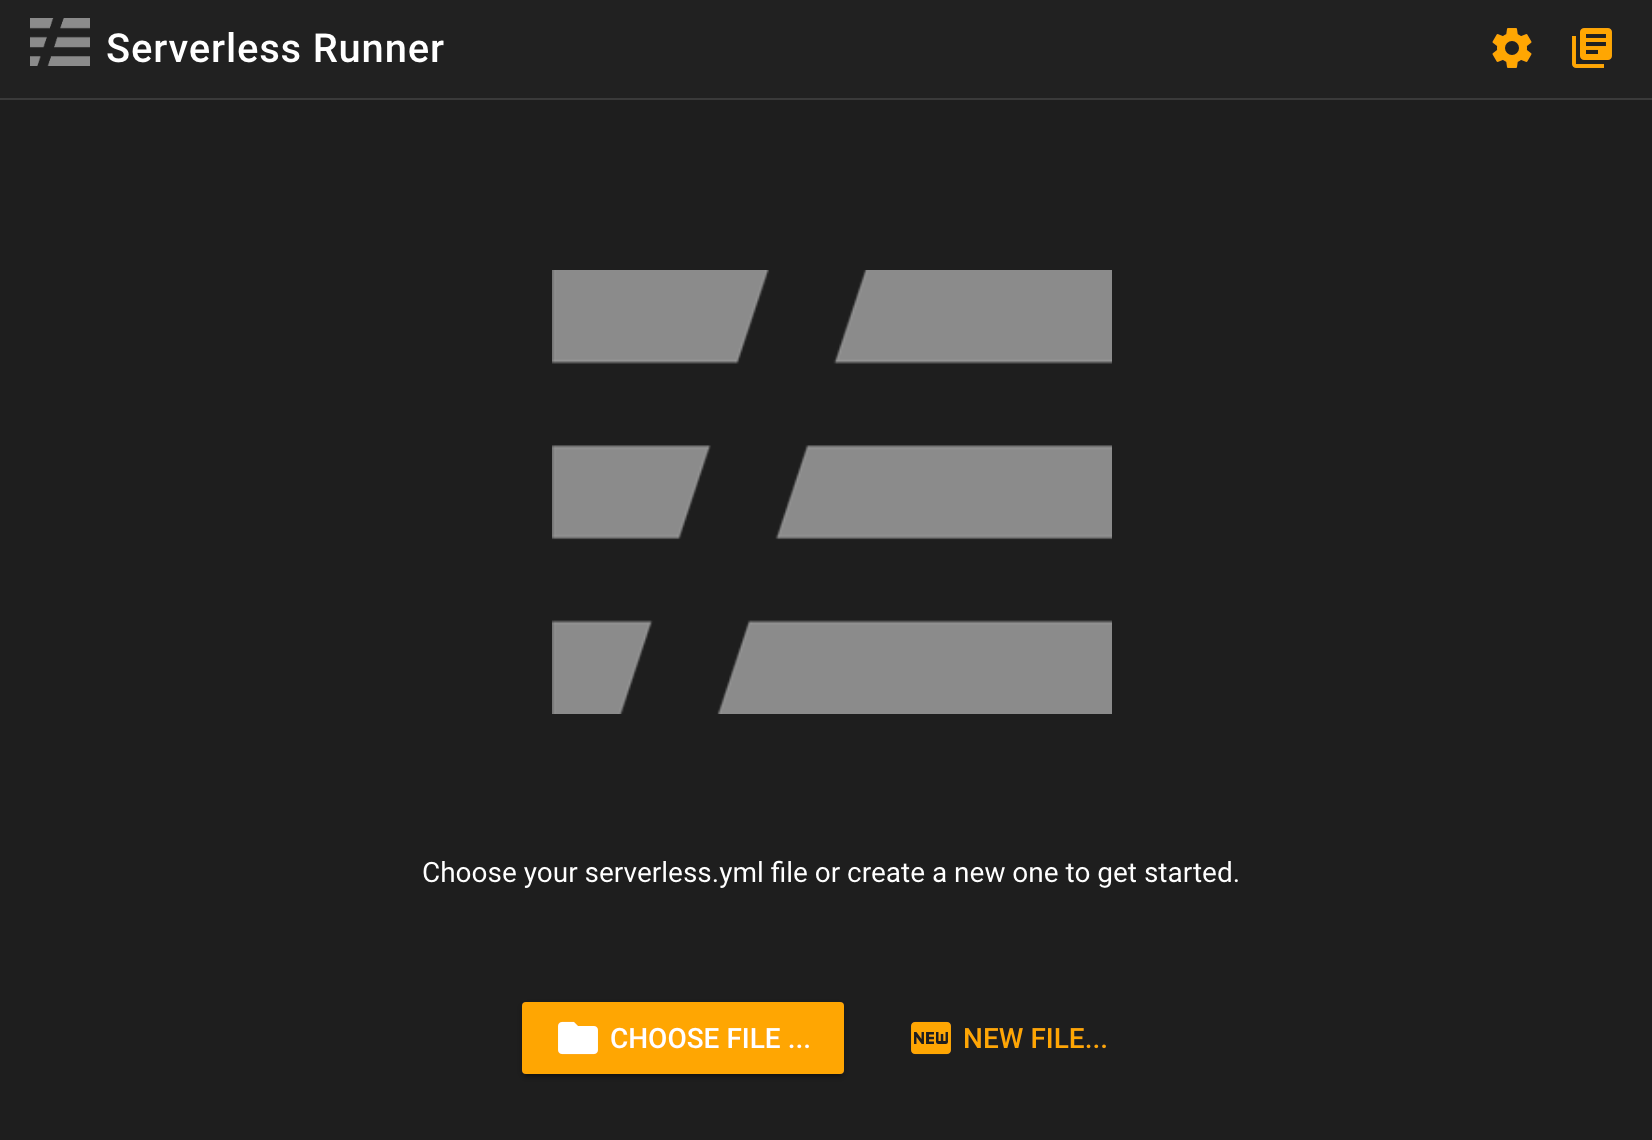
# 9. Deploying your Serverless Framework IaC
Serverless Framework is our favorite tool for deploying all the fidly bits of connecting our different AWS Services to Lambda. Our Serverless Dashboard gives you insights into how long your runs are taking. And Our Serverless Runner allows you to save all your configuration for different environements, and then run your serverless.yml execution with the click of a button.
# 10. Managing your Docker System
Under the hood, all of the services you use in Commandeer like LocalStack, Serverless Framework, Ansible, Circle.ci, and Bash are done inside a Docker container. This allowed us to have a robust package of tools that could be used on Windows, Mac, and Linux. In doing this, we ended up building a really powerful UI to manage your docker system. You can view system diagrams, run your docker compose, download images from DockerHub, execute commands against your container, and in version 1.8 view your actual files in the container and volumes.
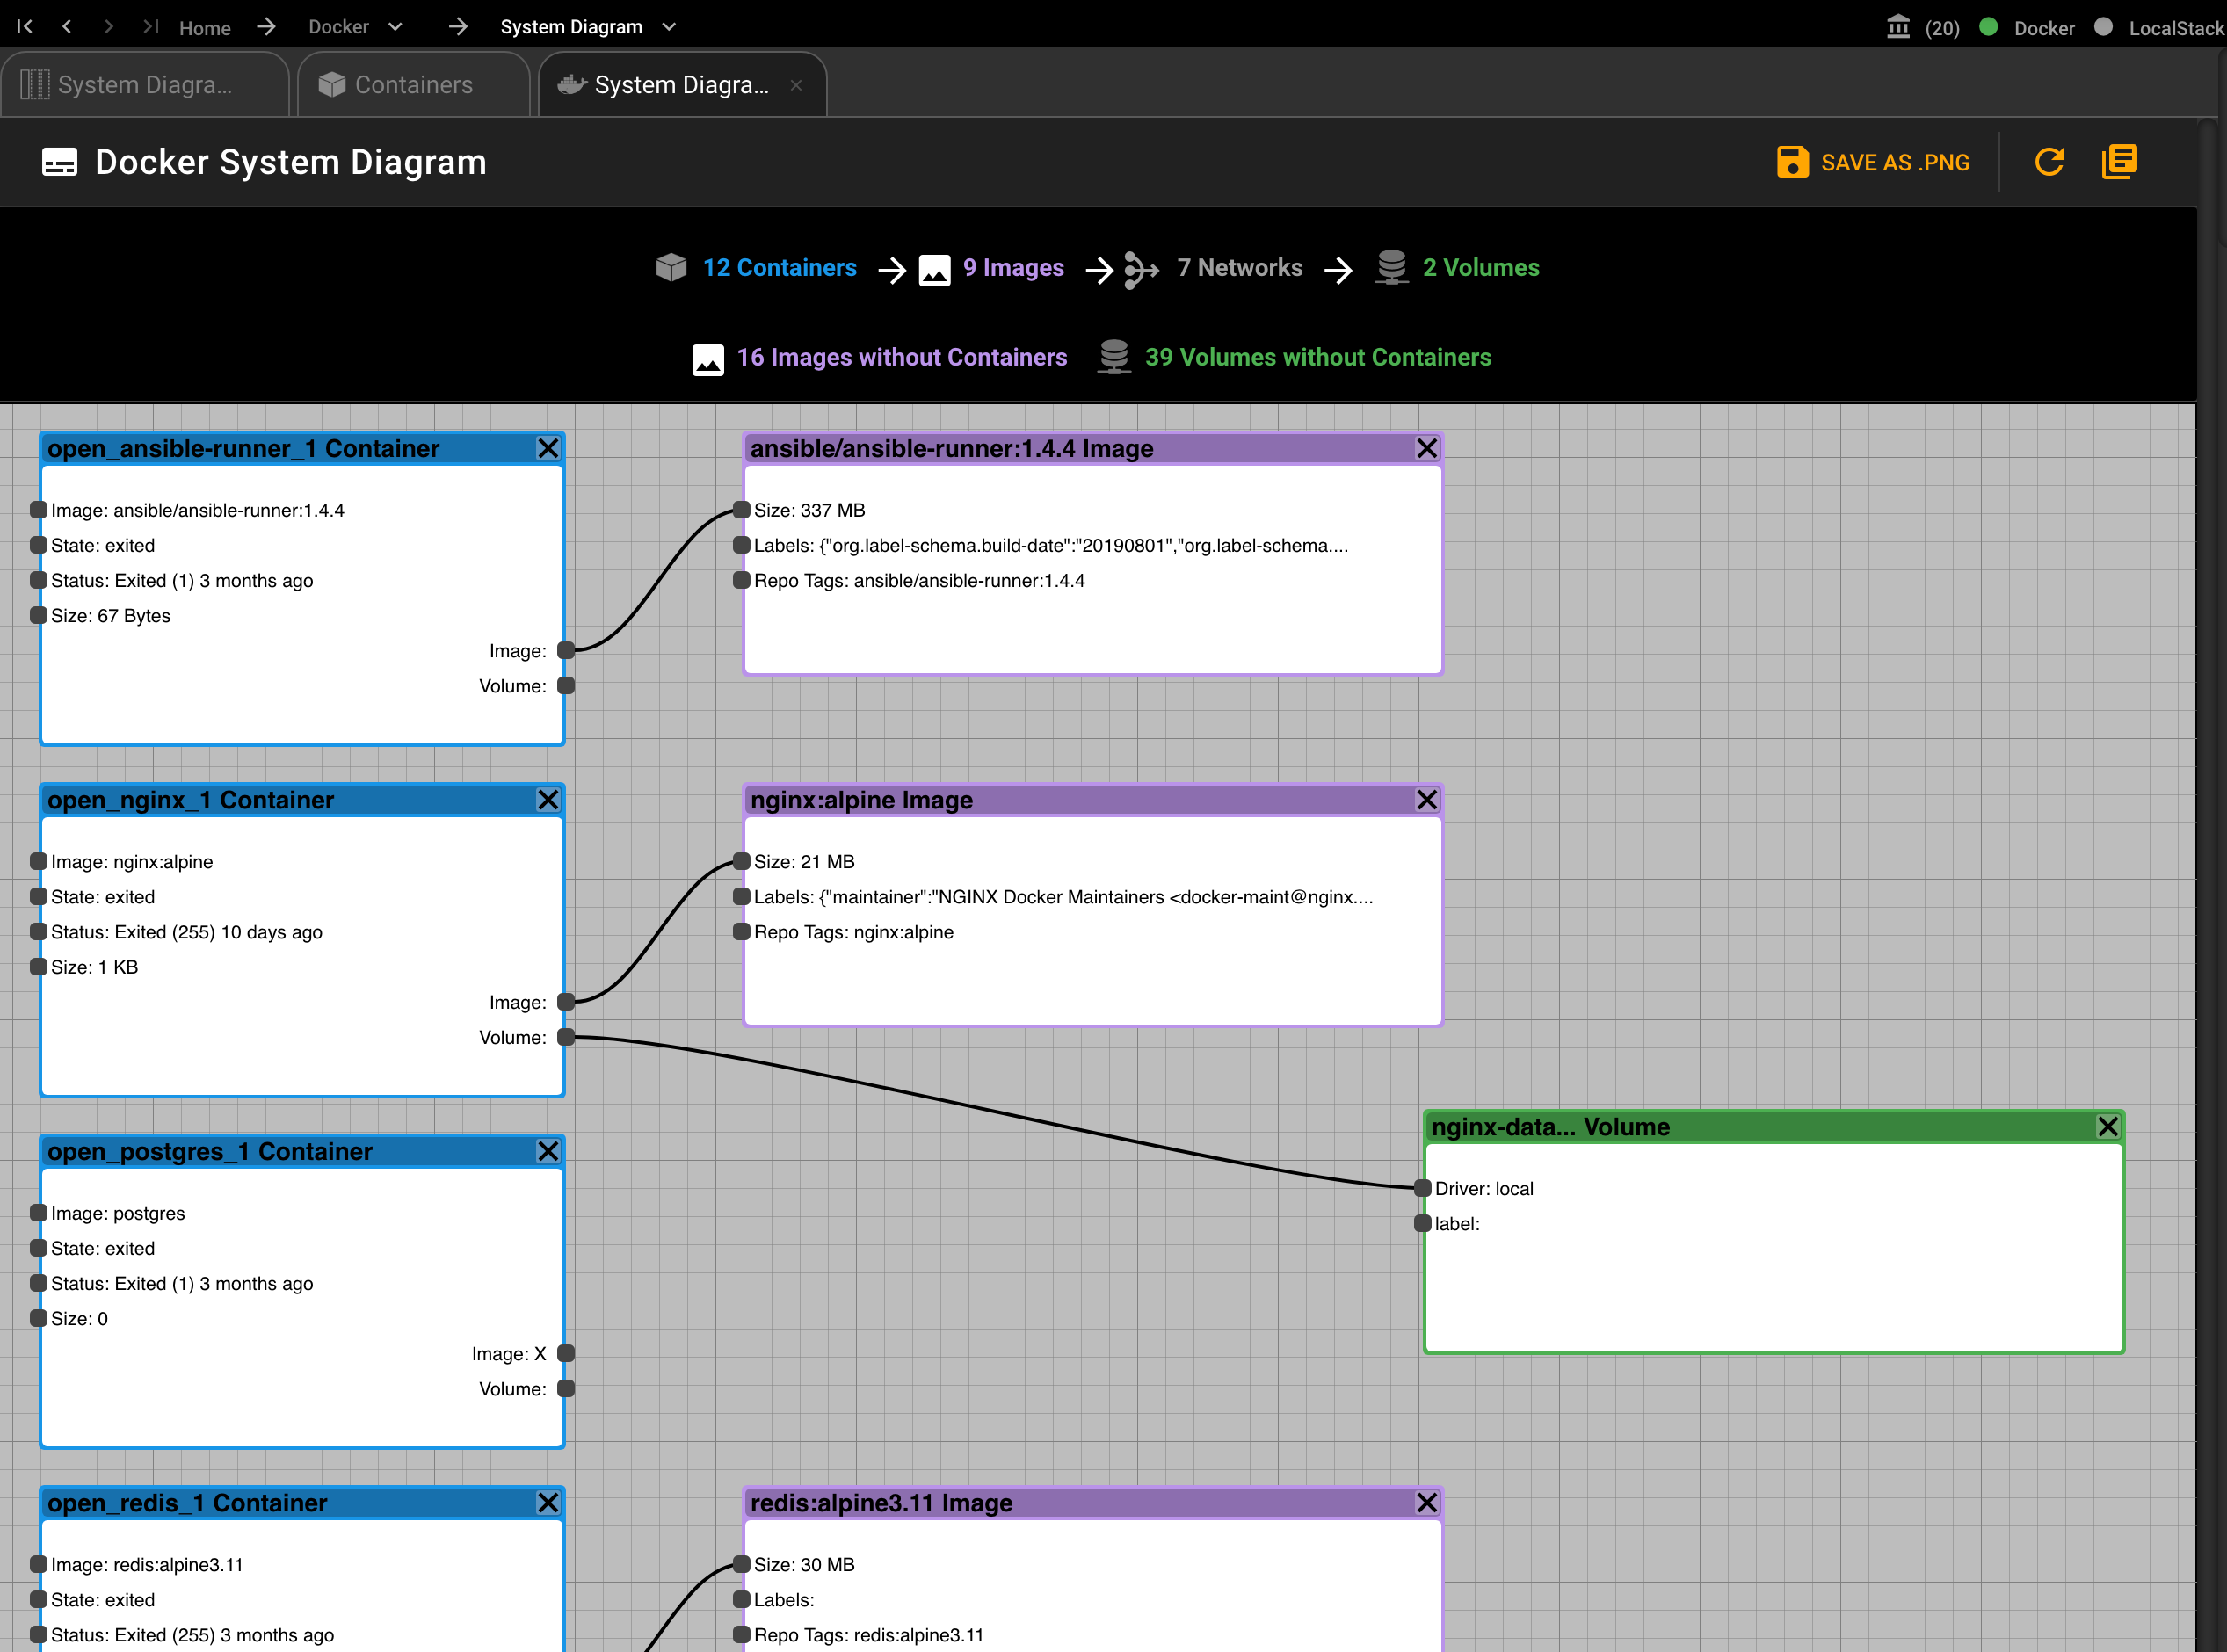
Docker System Diagram and Side Navigation
# Conclusion
Our aim at Commandeer is to make visibility into your entire cloud system as great an experience as what you have been used to in the monolith world. While the tooling in the cloud has grown over the past 7 years, the developer has been short-changed on how they have to manage it all. By using Commandeer, you can stay out of the endless website portal login dance, and just see your data and system as easily as you view your files in your favorite IDE.
There are hundreds of different uses for Commandeer, and this article only highlights 10, but we think that once you start to depend on it more and more for seeing pieces of your system and the underlying data, you will have a better experience as a developer working in the cloud.
Download the Commandeer App - 15-day Free Trial - The #1 developer IDE to manage your serverless and container infrastructures, both locally and in the cloud. With support for 30+ of the best cloud services out there.